Bitcoin Cash (BCH) seems to be tiring out after the latest move. The BCH price has not been able to sustain any upward movement, and a telling sign has emerged on the chart that traders do not treat trivially.
Crypto analyst BATMAN pointed this out on the 4-hour chart, noting that BCH is forming a clean head-and-shoulders structure. It is not a prediction, but it is a warning that upside momentum may be running out.
What The BCH Chart is Showing
The BCH price makes a formation of the left shoulder, the top high represented by the head, and the lower high represented by the right shoulder. Price tends to approach the neckline, which is the level that usually indicates the path the future market will take.
This pattern shows a shift in behavior. Buyers were strong earlier, but each push higher is getting weaker. Sellers are stepping in sooner, and price is failing to reclaim previous highs.
Top analyst BATMAN shared on X that this is exactly the type of setup traders look for when markets lean too heavily in one direction. Most participants expect continuation. Patterns like this remind them that reversals often show up when confidence is high.
Read Also: Solana (SOL) Flashed a Quiet Bullish Signal as SOL Price Defends Key Support
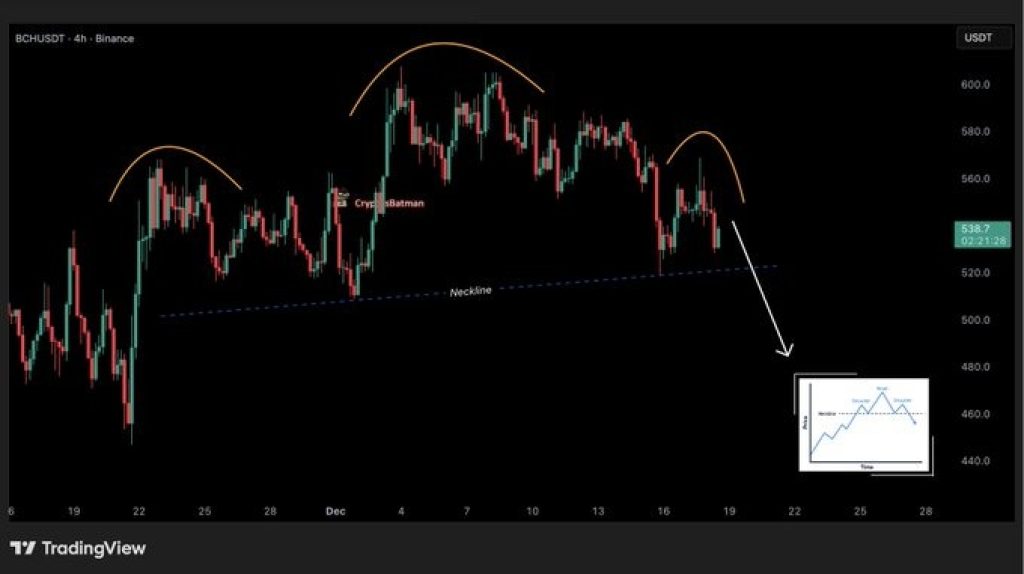
The neckline is the key level to watch. As long as the BCH price holds above it, the pattern remains incomplete. If price breaks below and fails to recover quickly, the structure activates.
That does not guarantee a crash. It usually points to a pullback or a deeper correction, often toward prior support zones. On the chart shared, the projected move suggests downside risk if the neckline gives way.
This is why BATMAN framed it as a hedge idea rather than an outright short call. It is about managing risk, not predicting certainty.
Market Bias Is Still Leaning Long for Bitcoin Cash Price
One reason this setup stands out is positioning. Many traders remain biased to the upside after BCH’s recent strength. That bias can blind the market to counter-trend setups.
As BATMAN noted, human nature leans long, especially after a strong move. Head-and-shoulders patterns tend to form when optimism is still present, not after panic sets in.
That makes this zone important. If buyers step in and reclaim control, the pattern fails and the trend continues. If not, the market may need to cool off first.
In the short term, all eyes are on how the BCH price reacts near the neckline. Strong buying and a quick bounce would ease bearish pressure. Weak follow-through or a clean breakdown would likely invite more selling.
For now, this is a warning, not a verdict. The chart is asking a question, and BCH next move will answer it.
Subscribe to our YouTube channel for daily crypto updates, market insights, and expert analysis.