The Bitcoin price has entered a fragile phase after losing one of its most important trend supports. The latest chart shared by analyst Crypto Patel suggests the market may still face a deeper correction before the next major bull cycle begins.
Top analyst Patel shared on X that the current setup closely mirrors previous Bitcoin cycles. In those periods, the market first experienced a sharp drawdown that forced weaker hands out before starting the next explosive rally.
This time, the analyst believes the long-term upside could eventually stretch as high as $350,000, but the path there may involve a painful drop first.
At the moment, Bitcoin is trading roughly 47% below its $126,200 all-time high, and several technical signals on the chart show the structure has weakened in the short term.
What you'll learn 👉
Here’s What Bitcoin Chart Is Showing
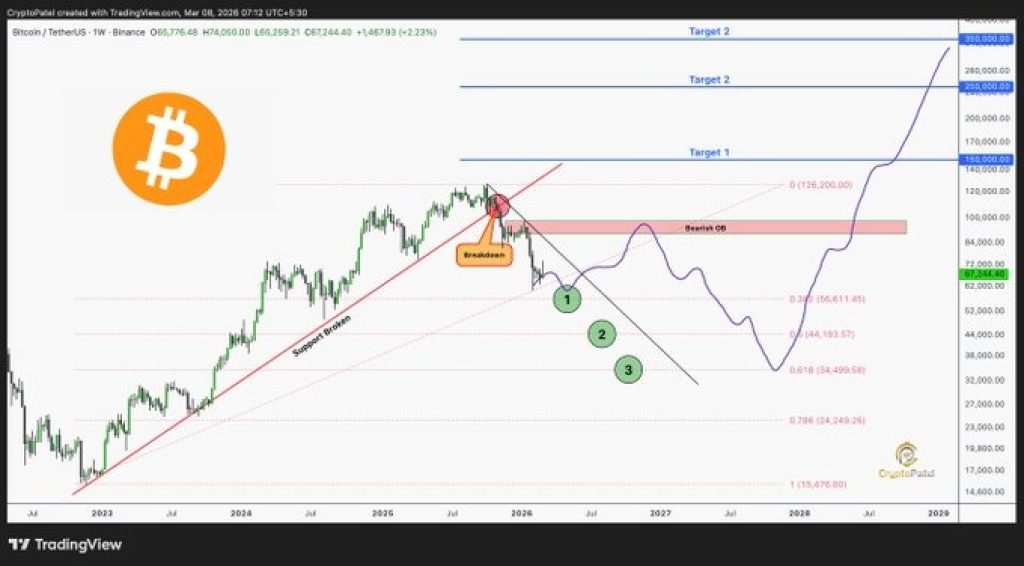
The chart above points to a major technical change that happened after Bitcoin lost the ascending trend line that has been supporting the price action since November 2023. This line has been the backbone of the previous price rallies.
Once that support gave way, the market structure flipped bearish. The breakdown also pushed the BTC price back below a key resistance region between $90,000 and $98,000, which Patel identifies as a bearish order block currently limiting any strong upside attempts.
This combination of a broken trendline and overhead resistance creates the conditions for a deeper retracement before the next major move begins.
The projection on the chart outlines a descending path that could take Bitcoin through several key Fibonacci retracement levels where long-term buyers may begin accumulating again.
Patel identifies three significant zones where the Bitcoin price is likely to see strong buying pressure during the deeper correction.
The first level is at $56,611. This level is where the 0.382 Fibonacci retracement level is. This is the first significant buying zone for the Bitcoin price.
However, if the selling pressure continues for the Bitcoin price, the next significant level is at $44,193. This level is where the 0.5 Fibonacci retracement level is. The Bitcoin price has historically visited this level during the mid-cycle retracement before continuing the long-term uptrend.
The last key buying level for the Bitcoin price is at $34,499. This level is where the 0.618 Fibonacci retracement level is. This is often referred to as the golden pocket. This level has historically attracted strong institutional buying during previous cycles.
Read Also: Silver Price Could Explode as Banks Rush to Cover Massive Short Positions
Bitcoin Long-Term Targets Stretch Toward $350K
While the near-term outlook remains cautious, the long-term projection in Patel’s chart paints a far more bullish picture.
Once the accumulation phase ends, the analyst believes that a new cycle of expansion will begin for Bitcoin. This cycle may cause the BTC price to achieve various milestones.
The first long-term milestone for the price of Bitcoin will be $150,000. After that, the price may rise to $250,000. The last milestone for the price of Bitcoin is shown in the last projection of the chart. The price of Bitcoin may rise to $350,000.
The curved projection drawn on the BTC chart reflects the kind of exponential growth Bitcoin has historically experienced once new bull markets gain traction.
Why These Levels Matter For Bitcoin
The logic behind these zones comes from how Bitcoin has behaved in previous cycles. Major rallies were often preceded by sharp corrections that pushed the price back to Fibonacci support levels where stronger hands began accumulating.
During those phases, retail traders often panic and sell into weakness, while larger players gradually build positions.
Patel believes the same pattern may play out again. If that happens, the next major opportunity could appear during periods when sentiment across the market turns extremely negative.
For now, the chart suggests the Bitcoin price may still need to complete its corrective phase before the next major upward expansion begins.
Subscribe to our YouTube channel for daily crypto updates, market insights, and expert analysis.