
Bitcoin price continues to move inside a tight range just below $73,000, and that quiet price action now carries a clear warning. The latest chart shared by Crypto Patel shows BTC sitting right under a critical resistance zone that could decide the next major move.
That level sits between $76,000 and $79,000, and the chart makes it clear why this zone matters so much.
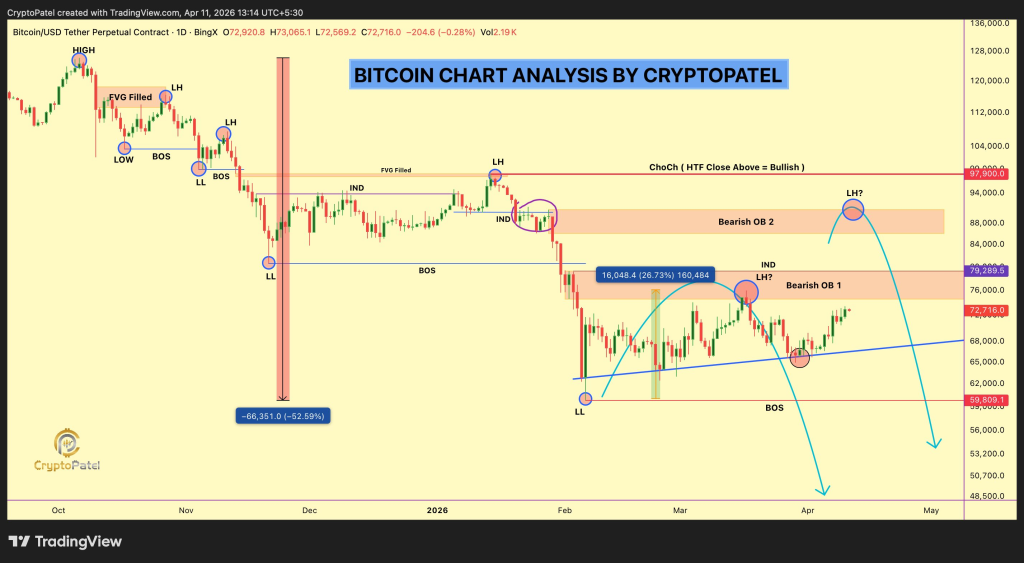
A close look at the BTC chart shows repeated rejection from the same resistance zone marked as Bearish Order Block 1. Price attempted to push higher in recent sessions, yet every move into that region failed to hold.
Crypto Patel points out that BTC remains below this order block, and that detail shapes the current outlook. The chart shows a lower high forming near that region, which often signals that sellers still control momentum at key levels.
That reaction reveals something important. Buyers are active at lower levels, yet they have not been able to break through the ceiling above $76,000.
Another detail on the chart adds to the concern. Price recently bounced from a rising support trendline near $65,000, which means the market is now trapped between rising support and strong resistance. Such structures usually lead to a decisive move once one side gives way.
Break Above Resistance Could Open Path Toward $90,000 Region
Crypto Patel explains that a confirmed move above $79,000 could change the structure completely. The next major zone sits between $86,000 and $90,000, marked as Bearish Order Block 2 on the chart.
That area acted as a supply zone earlier in the trend, which means price could move quickly toward it if resistance breaks. The previous imbalance zone on the chart also sits near that region, which increases the likelihood of a fast reaction if BTC gains strength.
Historical patterns also offer clues here. Bitcoin often moves quickly once it clears major resistance levels, especially when price has spent time consolidating just below them.
Crypto Patel highlights that this breakout scenario depends entirely on how price reacts inside the $76,000 to $79,000 range.
Failure At Resistance Could Send BTC Price Toward $50,000 Zone
The bearish scenario carries more weight if rejection continues at the same level. Crypto Patel makes it clear that failure to break above the order block could push BTC toward a new low below $50,000.
The chart shows a projected path where price first loses the rising trendline support. A breakdown below that structure could open the door for a move toward the $59,000 level, which sits as a previous support zone.
Read Also: Bittensor (TAO) Slides 25% in 3 Days: Time to Buy Again or Stay Off?
Further weakness could extend the drop toward the mid $50,000 range, and the chart even outlines a deeper move toward $48,000 if selling pressure builds.
Crypto Patel repeats that the key decision point remains the same. Price action around $76,000 to $79,000 will likely determine whether Bitcoin pushes higher or heads lower.
Subscribe to our YouTube channel for daily crypto updates, market insights, and expert analysis.