
BTC price has bounced back above $106,000 after dropping from recent highs near $111,000, and that move has grabbed traders’ attention. Some are wondering if this could be the start of a fresh push higher.
But not everyone’s convinced. Veteran trader Matthew Dixon shared a chart on X pointing out a flaw in the bounce. He noted that the recent move shows wave overlap, which breaks the rules of a proper bullish wave pattern. In his view, this looks more like a temporary correction, not the beginning of a new rally.
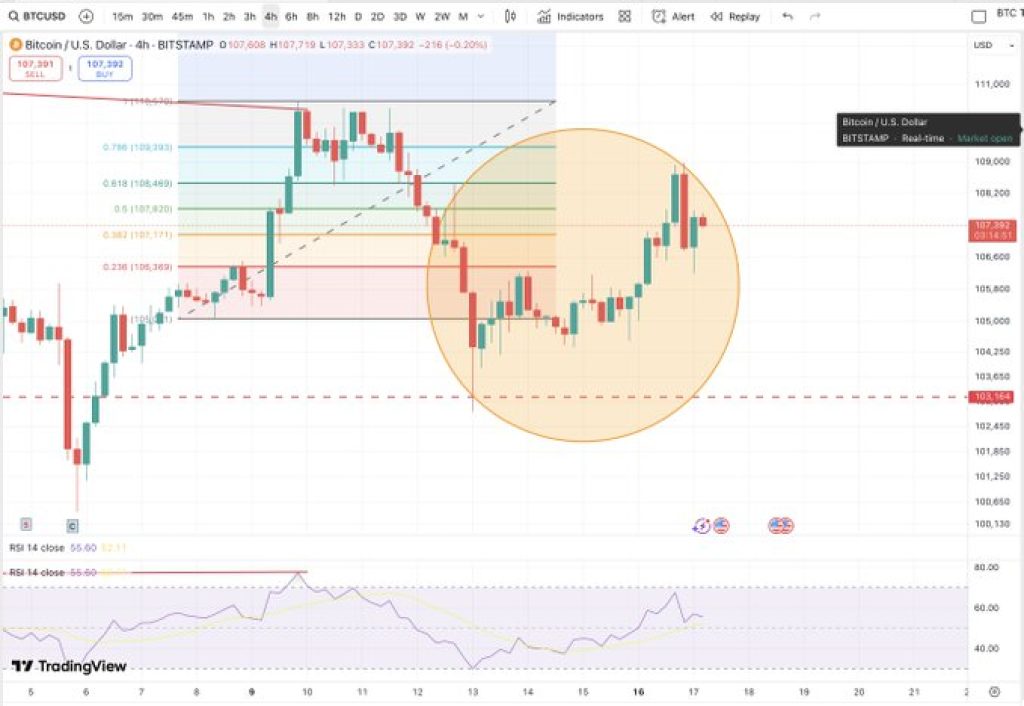
From a technical perspective, the bounce ran into resistance around $108,200 to $108,500 and hasn’t managed to break through. The price did climb into some key Fibonacci retracement levels but couldn’t hold above them. The RSI is sitting around neutral, so there’s no strong momentum either way right now. Traders are now watching to see if Bitcoin price can hold its ground, or if it’s heading back down toward $102,450.
BTC Wave Structure Signals a Corrective Move
Matthew Dixon posted a chart showing a wave formation on the 4H Bitcoin chart. In his analysis, a $50 overlap between wave 1 and wave 4 invalidates the possibility of an impulsive move. According to Elliott Wave Theory, this type of overlap breaks a core rule and shifts the interpretation toward a corrective pattern.
Based on this structure, Dixon suggested that lower prices may follow. The bounce appears to follow a three-wave correction rather than a five-wave impulse. He stated that this is “a correction, higher and lower prices will resume soon,” though he reiterated a bullish outlook over the long term.
Moreover, Bitcoin price recently bounced from around $104,250 and climbed as high as $108,500, landing right at the 0.618 Fibonacci retracement level, a spot traders often watch closely. But it didn’t hold there for long. The rejection near $108,200 to $108,500 suggests there’s still some serious resistance in that zone. Until Bitcoin can break through that area with strength, this bounce doesn’t look like a confirmed move higher just yet.
Read Also: XRP Just Flipped the Switch: These On-Chain Metrics Surge to Record Levels
Bitcoin price boasts support levels of $106,000 and $104,250. Below those, it can extend further to around $102,450, the next major support that investors are keeping an eye on. Price action near these levels is likely to dictate short-term trading activity.
Even after the tiny bounce, Bitcoin is still clinging to the space just under $110,000, and that ceiling wont budge. The chart keeps printing lower highs, and the price is drifting, not charging. The RSI is parked in the middle, so momentum is almost absent.
If Bitcoin price finally vaults over $110,000, we might see a genuine change in tone. Until then, the market feels stuck in limbo. Long-term hopes are still alive, yet in the short run nothing has really shifted.
Subscribe to our YouTube channel for daily crypto updates, market insights, and expert analysis.

We recommend eToro
Wide range of assets: cryptocurrencies alongside other investment products such as stocks and ETFs.
Copy trading: allows users to copy the trades of leading traders, for free.
User-friendly: eToro’s web-based platform and mobile app are user-friendly and easy to navigate.