Bitcoin (BTC) Bull Market Is ‘Fragile but Alive’ – Analyst Breaks Down the 10 Signals You Need to Watch

The Bitcoin (BTC) price is sitting in one of the strangest spots it has seen in years. The price has pulled back sharply from the $126,000 peak, but instead of collapsing into a full downtrend,
BTC is holding a wide, choppy range with both bullish and bearish forces fighting for control.
Analyst Crypto Seth summed it up perfectly: the bull market isn’t dead – but it’s fragile, and every move from here matters.
Below is a breakdown of the 10 signals he highlighted, and why they’re shaping Bitcoin’s next major trend.
What you'll learn 👉
The Bull Case: Why the BTC Price Uptrend Still Has Life
Seth points to several structural forces that continue to support a long-term bullish path.
Vanguard and BlackRock are rolling crypto-exposed ETFs and mutual funds into the mainstream.
BlackRock’s IBIT even hit $1 billion in trading volume on its first day at Vanguard. Deeper liquidity and clean access make Bitcoin far easier for traditional investors to buy and hold.
Even with recent volatility, spot Bitcoin ETFs remain a major shift in market architecture. If macro conditions ease, inflows can return quickly and when they do, they usually move price with force.
Moreover, the Federal Reserve is expected to cut rates through 2026. Looser monetary conditions typically drive money back into risk assets, and Bitcoin is high on that list.
April 2024 cut new Bitcoin (BTC) issuance in half. These supply squeezes tend to fuel longer, slower rallies – not instant spikes. Seth argues this dynamic hasn’t fully played out yet.
In addition, large research desks still predict potential +200% upside between 2025 and 2030. Bitcoin’s maturity and global liquidity give it room to grow, just not as explosively as earlier cycles.
The Bear Case: Where the Bull Market Starts to Crack
But Seth also warns that several major risks are forming beneath the surface – and they can’t be ignored.
He said If Bitcoin classic halving cycle peaked early, then the bull phase might be behind us. That’s one of the biggest concerns for cycle-based investors.
The BTC price fell below the 50-week moving average, a level that often separates sustainable uptrends from distribution phases. This break is one of the clearest bearish signals on the chart.
When volatility hit, ETF issuers saw heavy outflows. That proves institutional money can exit as fast as it enters. Drawdowns of this size can happen during bull runs – but repeated ones weaken momentum and sentiment.
Moreover, as BTC grows into a trillion-dollar asset, the “easy” exponential runs naturally get harder. Analysts expect future gains, but slower ones.
Read Also: Here’s Why Chainlink (LINK) Price Is Pumping Today
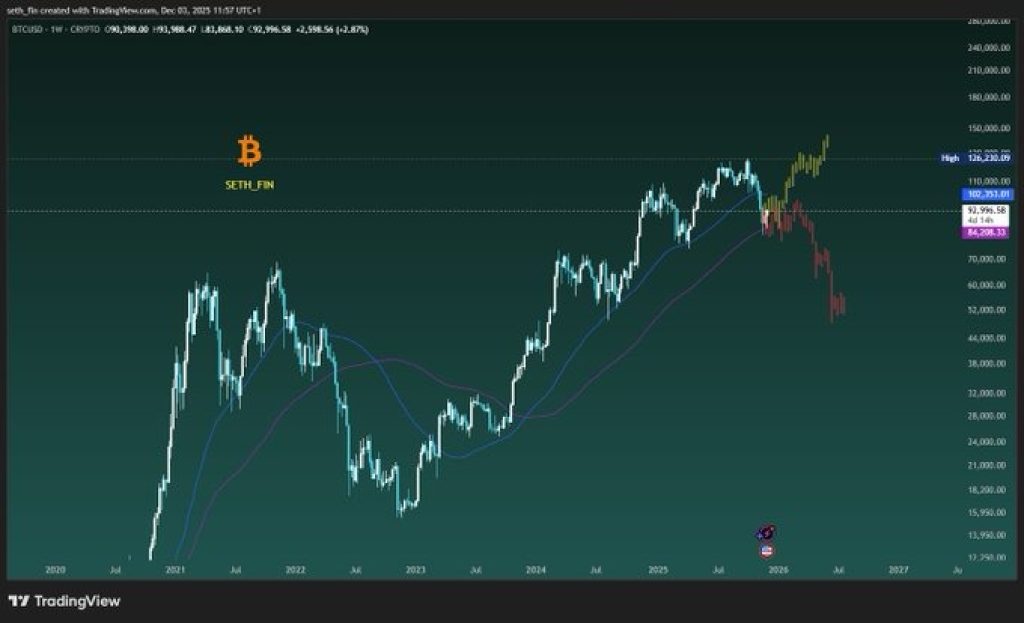
Here’s What The BTC Chart Is Showing
Seth’s chart reflects exactly what he’s describing: two opposing paths.
The bullish projection shows the BTC price stabilizing, reclaiming the mid-range, and grinding toward higher highs – a classic post-halving continuation structure.
The bearish projection shows the opposite – a failed reclaim and a drawn-out slide into deeper correction territory.
Both scenarios remain open. That’s the point.
Bitcoin Price Outlook
The message from Seth is simple: the Bitcoin bull market is still alive, but it’s walking a tightrope.
Institutional rails are stronger than ever. Macro conditions could turn supportive again. The halving is still tightening supply.
But cycles get tired. Technical breaks matter. Outflows reveal hidden weakness.
Right now, the Bitcoin price sits between those two stories – and whichever side gains even a little more weight will decide the next big move.
Subscribe to our YouTube channel for daily crypto updates, market insights, and expert analysis.