Bitcoin has dropped to around $97,000, marking its lowest level since April. The decline comes as U.S. spot Bitcoin ETFs recorded their second-largest daily outflow on November 14, with $869 million leaving the market in a single session. Over the past three weeks, cumulative withdrawals have hit $2.64 billion, showing a clear pullback in institutional conviction. Much of Bitcoin’s 2025 rally came from steady inflows into ETF products, so this shift has created noticeable pressure across the market.
Amid this backdrop, trader CasiTrades believes Bitcoin is now nearing the end of its correction. As per her test analysis, BTC is approaching the major support cluster that has been on her chart for weeks.
What the Chart Shows: Final Leg of the Correction Nearing
CasiTrades’ chart highlights a clear five-wave corrective structure. The market is currently moving through the final wave, marked as (5), which is sliding directly into the green support zone drawn between $97,000 and $94,000. The structure has respected Elliott Wave proportions almost perfectly, with each rejection aligning with Fibonacci projections.
The chart shows Bitcoin already touching the 0.236 macro Fibonacci support near $97,101 on Binance. This level has served as the base target during the downtrend. The next key level sits at the 0.618 extension around $96,683, which is also inside the same green accumulation box. Under that sits the full wave C projection at $93,679, which represents the most bearish but still technically correct final low.
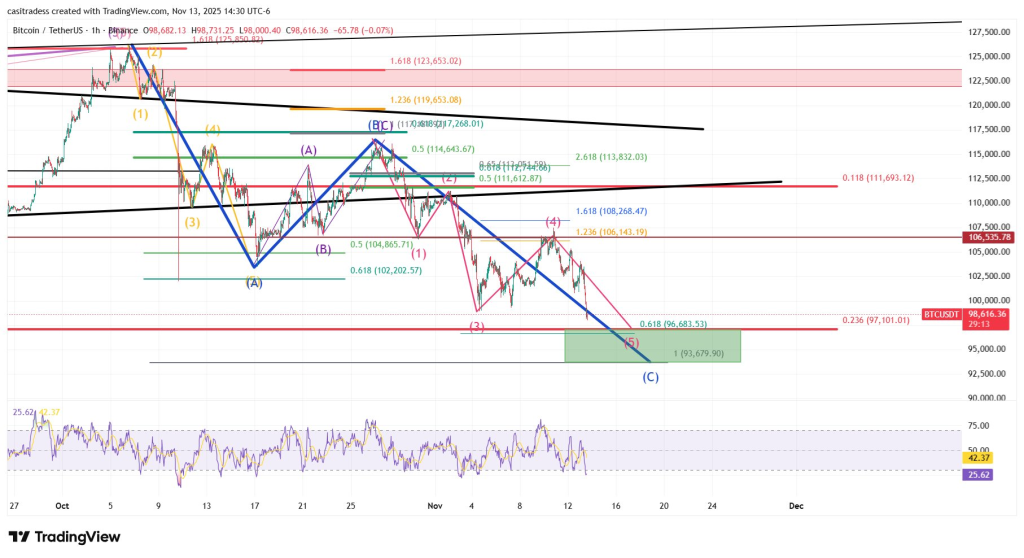
Momentum indicators add extra weight to the idea that the drop is nearly complete. The RSI on the one-hour timeframe is sitting near oversold levels, hovering around 25–30, which mirrors previous reaction zones earlier in the correction. Every prior time RSI tagged these levels, price staged a recovery.
The chart also shows that each bounce attempt from waves (2) and (4) failed at the same descending trendline CasiTrades draws in blue. The market has respected that trendline perfectly, providing clean confirmation that the structure remains intact and the correction is unfolding exactly as projected.
What matters now is where the final low forms. CasiTrades believes $94,000 is becoming increasingly likely, followed by a sharp reclaim of $97,000 to confirm the higher low. That reclaim would act as the trigger for momentum to return.
Altcoins are showing the same setup. XRP, HBAR, ALGO, and XLM are all sitting near their macro Fibonacci supports at the same time Bitcoin approaches its own cluster. This confluence often appears at the end of broad market corrections.
If the reaction is strong at $97,000 or $94,000, the market may finally have the ingredients needed to break out of this multi-week downtrend.
Subscribe to our YouTube channel for daily crypto updates, market insights, and expert analysis.