Binance Coin (BNBUSD) has been on a rollercoaster ride, with its price action revealing intriguing patterns that could offer valuable insights into its future trajectory.
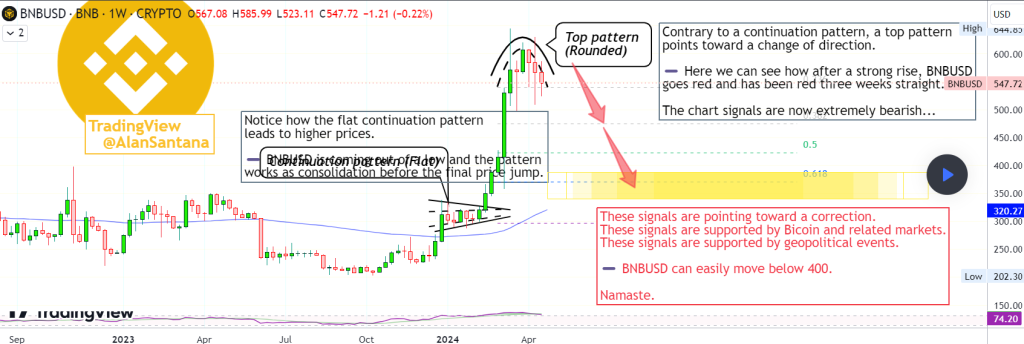
In a technical analysis by Alan Santana, he explores two distinct patterns: a continuation pattern with a flat structure and a top pattern with a rounded structure. By comparing these patterns and examining their implications, we can better understand the current market sentiment and potential price targets for BNBUSD.

What you'll learn 👉
Continuation Pattern
The continuation pattern, which follows a strong rise in BNBUSD, goes red and has been red for three weeks straight. This pattern typically works as consolidation before the final price jump, suggesting that the market may be gearing up for a significant move.
Notably, this continuation pattern emerges right after the initial breakout, which is a perfect setup for a potential upward movement. The flat structure of the pattern indicates that the market is taking a breather before resuming its upward trend.
Top Pattern (Rounded)
In contrast to the continuation pattern, the top pattern exhibits a rounded structure and comes right after a major bullish wave. This pattern is particularly significant because it points toward a change of direction in the market.
The rounded nature of the top pattern suggests that the bullish momentum is gradually losing steam, and a reversal may be on the horizon. This pattern is a clear warning sign for investors and traders, as it indicates that the market may have reached a peak and could be heading for a correction.
Doge2014 raises 500K in days celebrating Dogecoin. Make potentially big profits and get in on exclusive airdrop!
Show more +Current Market Outlook
Based on the analysis of these two patterns, it appears that BNBUSD has experienced a continuation pattern followed by a top pattern. The chart signals are now extremely bearish, suggesting that a correction is currently underway.
The presence of the top pattern after a strong bullish wave is a powerful indicator that the market sentiment has shifted, and a significant price drop may be imminent. Investors and traders should exercise caution and prepare for potential downside risk.
Potential Price Target
According to the technical analysis, BNBUSD can easily move below the $400 mark. This price target is supported by the bearish signals generated by the top pattern and the overall market sentiment.
Investors and traders should keep a close eye on key support levels and be prepared to adjust their strategies accordingly. While the $400 level may act as a psychological barrier, a breach of this level could open the doors for further downside pressure.
Additional Factors to Consider
It is essential to note that the current market outlook for BNBUSD is not solely based on the continuation and top patterns. Other factors, such as Bitcoin’s price action and the overall cryptocurrency market sentiment, can also influence BNBUSD’s trajectory.
Geopolitical events and regulatory developments in the cryptocurrency space may also play a role in shaping the market’s direction. Investors and traders should stay informed about these external factors and incorporate them into their decision-making process.
The technical analysis of Binance Coin (BNBUSD) presents a compelling narrative, featuring a continuation pattern and a top pattern. The bearish signals generated by these patterns indicate that a correction is currently underway, potentially leading to a significant price drop for BNBUSD.
Subscribe to our YouTube channel for daily crypto updates, market insights, and expert analysis.
We recommend eToro
Wide range of assets: cryptocurrencies alongside other investment products such as stocks and ETFs.
Copy trading: allows users to copy the trades of leading traders, for free.
User-friendly: eToro’s web-based platform and mobile app are user-friendly and easy to navigate.


