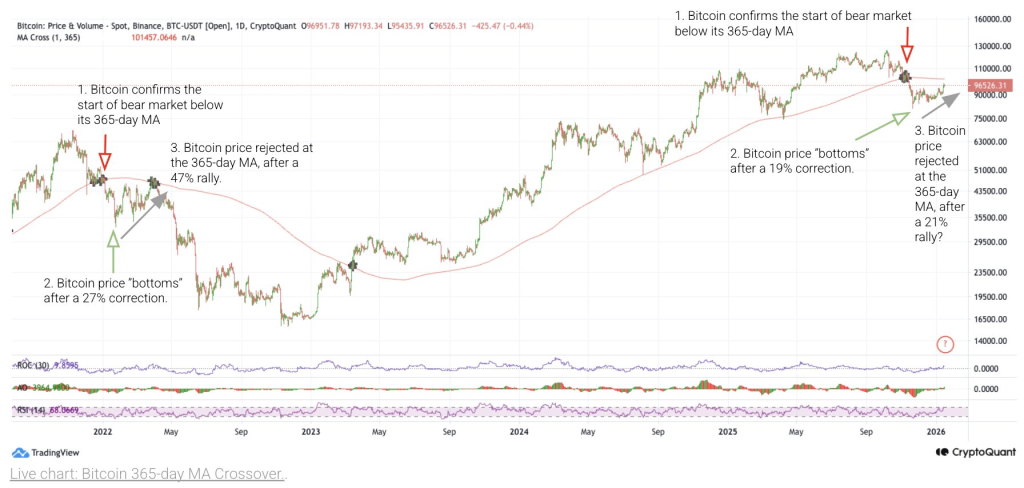
Bitcoin is once again approaching a level that carries real historical weight. According to the CryptoQuant chart, price is moving toward the 365-day moving average, a long-term trend line that played a decisive role during the 2022 bear market.
Back then, this same moving average acted as a ceiling. Bitcoin briefly bounced, failed to reclaim it, and rolled over into a deeper drawdown. That context is why traders are watching this zone so closely now.
What you'll learn 👉
BTC Chart
The 365-day moving average sits near the $100,000–$101,000 area. Bitcoin is currently trading below it, which matters. In long-term trend analysis, reclaiming this line often signals a return to a sustained bull market. Failing to do so keeps the market in a defensive posture.
Looking at past cycles on the chart, the pattern is clear. In 2022, Bitcoin dropped below the 365-day MA, attempted a recovery rally of roughly 47%, and then got rejected. Only after a much deeper correction did price finally form a durable bottom.
In the current setup, Bitcoin has already experienced a notable pullback, roughly in the 20% range from recent highs. That correction is similar in size to previous “mid-cycle” declines, not full capitulation events. The question now is whether this pullback is enough.
Why This Level Matters So Much
This is not just a moving average. It’s a line that long-term investors, funds, and systematic strategies all watch. When Bitcoin trades below it, rallies tend to be sold. When price holds above it, dips tend to be bought.
Right now, the market is in between. Bitcoin has bounced, but it has not reclaimed the level that would confirm strength. If price pushes into the $100K–$101K area and gets rejected again, it would mirror the early stages of the 2022 bear market structure.
On the other hand, a clean daily and weekly close above the 365-day MA would weaken the bearish case significantly. That would suggest the market has absorbed selling pressure and is ready to move higher.
Read also: Copper Crisis Is Just Getting Started: The Best Stocks to Watch
Momentum Indicators Add Caution
Momentum on the chart looks mixed. RSI is no longer oversold, but it also isn’t showing strong bullish divergence. Volume during the rebound has been solid, but not explosive. That points to a market that is stabilizing, not accelerating.
This kind of price behavior often leads to chop and volatility rather than immediate continuation in either direction.
A Balanced Take
This chart does not guarantee a bear market. It does, however, justify caution.
Bitcoin is at a decision point. Bulls need to reclaim the 365-day moving average and hold it. Bears are watching for another rejection to confirm that this rally is corrective, not structural.
Until one of those outcomes happens, the market remains vulnerable to sharp moves in either direction. In simple terms, this is not a place for complacency.
The next interaction with this level may define not just the next few weeks, but the broader trend for the rest of the year.
Subscribe to our YouTube channel for daily crypto updates, market insights, and expert analysis.