The cryptocurrency market is showing positive technical indicators for two significant assets, Avalanche (AVAX) and Synthetix (SNX), suggesting possible upward trends. altFINS has analyzed AVAX, indicating a steady uptrend, while World of Charts has provided a technical outlook on SNX, both offering critical insights for investors. These analyses reveal the growing interest and potential investment opportunities in AVAX and SNX amidst the volatile market landscape.
What you'll learn 👉
Avalanche (AVAX) Gearing Up for a 50% Upside Move
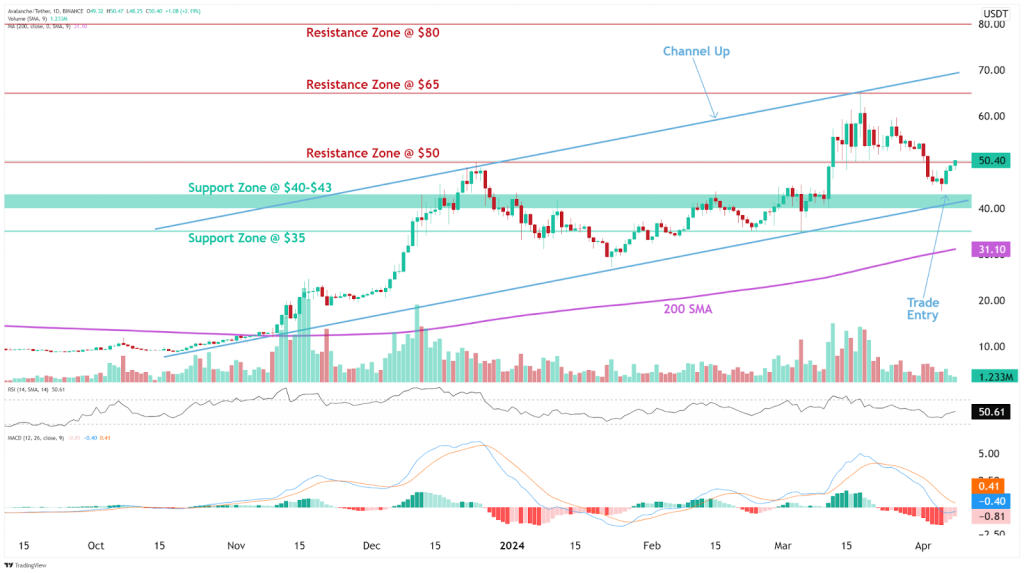
According to altFINS, Avalanche (AVAX) is exhibiting an uptrend, trading within a Channel Up pattern and forming higher highs and higher lows. The analysts suggest buying AVAX on pullbacks to the $40-$43 support zone, near the channel’s support trendline, as a potential swing trade entry.

Source: altFINS – Start using it today
With this setup, altFINS sees a potential upside of over 50%, targeting a move back towards $65. They recommend setting a stop-loss at $37.90 and suggest traders set a price alert for potential entry opportunities.
altFINS notes that AVAX is trading in a Channel Up pattern, where traders can initiate positions when the price fluctuates within the channel trendlines. However, in case of a breakout, either on the upper or lower side, the price could move rapidly in the direction of the breakout.
While the trend is neutral on a short-term basis, altFINS identifies an uptrend on the medium and long-term timeframes. The momentum indicators are mixed, with the MACD line below the signal line (bearish) but the RSI around 50 (neutral). However, the rising MACD histogram bars suggest momentum could be nearing an upswing.
Doge2014 raises 500K in days celebrating Dogecoin. Make potentially big profits and get in on exclusive airdrop!
Show more +Synthetix (SNX) Primed for a “Massive Bullish Rally”
World Of Charts (@WorldOfCharts1) has spotted Synthetix (SNX) bouncing from a “crucial area,” retesting an important support area. The analyst expects a “massive bullish rally” in case of a successful retest.
The 4-hour technical analysis chart for SNX shows a Falling Wedge pattern, generally considered bullish in technical analysis. The price movement has been enclosed within a narrowing range defined by a downward-sloping trendline on top and an upward-sloping trendline at the bottom.
There has been a breakout above the upper trendline of the wedge lately, often interpreted as a bullish signal. The chart includes a blue rectangular projection area, labeled with “23.849 (37.97%),” indicating a predicted price rise of 37.97% from the point of breakout.
The bottom trendline acts as the support level, while the top trendline, which has been breached, serves as a previous resistance now potentially turning into a support level. Traders will be closely monitoring these key levels for potential entry and exit points.
Hunting for a small cap coin that could explode 10x? We’ve unveiled a few last week alone.
Get all our future calls by joining our FREE Telegram community.
We recommend eToro
Wide range of assets: cryptocurrencies alongside other investment products such as stocks and ETFs.
Copy trading: allows users to copy the trades of leading traders, for free.
User-friendly: eToro’s web-based platform and mobile app are user-friendly and easy to navigate.


