
ASTER has a habit of testing patience. Price action drifts lower, confidence thins out, and then a chart like this starts telling a different story. Around $0.78, ASTER price is sitting at a level that looks quiet on the surface, yet the structure underneath suggests something far more interesting may be forming as 2026 approaches.
CZ fan Daivik, known on X as @Daivik555, recently laid out a bull case that ties price behavior, fundamentals, and long-term growth together. The chart adds another layer to that argument, especially when viewed through the lens of accumulation and breakout zones.
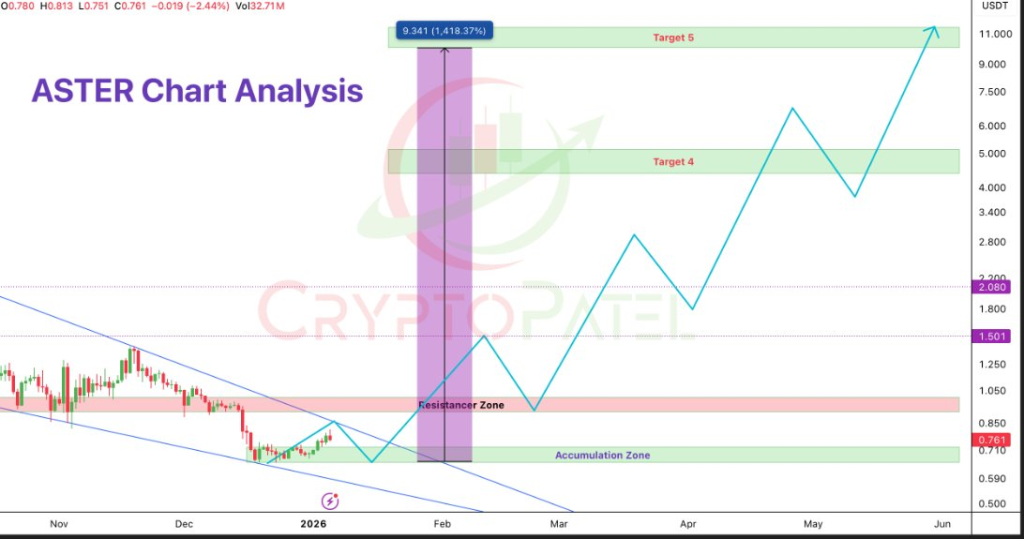
ASTER price has spent weeks compressing inside a broad descending structure before stabilizing near the accumulation zone highlighted on the chart. Price holding around $0.75 to $0.80 aligns with what CZ fan Daivik describes as a reset phase driven by token unlock pressure and macro uncertainty rather than structural weakness.
The chart shows ASTER building a base below the resistance zone near $1. This area matters because repeated reactions around it often precede directional moves. Accumulation zones tend to look boring in real time, yet they often mark where longer-term positioning quietly happens. According to @Daivik555, this phase reflects undervaluation rather than loss of relevance, especially with Aster maintaining strong usage metrics beneath the surface.
Aster Price Targets Line Up With Technical Breakout Levels
Once price clears the resistance band near $1, the chart projects a sequence of higher highs that map cleanly into the broader ASTER price prediction for 2026. The first expansion leg points toward the $3 to $4 region, which matches CZ fan Daivik’s average 2026 projection near $3.47 if growth continues at a steady pace.
Beyond that zone, the technical roadmap opens up more aggressively. The $5 area acts as a mid-cycle pause, while the upper targets extend toward $9 to $11. This is where the $10 narrative comes back into focus. CZ fan Daivik argues that if Aster TVL doubles again and derivative demand continues to grow, valuation expansion becomes mathematically plausible rather than speculative.
The chart does not promise a straight line upward. Pullbacks are built into the projection, reinforcing the idea of a volatile climb rather than a single impulse move.
ASTER Fundamentals Support the Long-Term Chart Outlook
Technical structure alone rarely holds up without real usage behind it. Aster stands out here. CZ fan Daivik highlights daily trading volumes near $25B, TVL climbing toward $12.4B from much lower levels, and open interest around $26B. These figures place Aster ahead of several well known perpetuals platforms.
User growth also tells part of the story. More than 695,000 users interact with Aster’s multichain perps, attracted by low fees, high leverage options, and yield bearing collateral. This activity forms the backbone of the ecosystem flywheel that @Daivik555 believes could drive ASTER price toward $10 to $15 by late 2026 under favorable conditions.
Read Also: Kaspa (KAS) Price Prediction for January
Upcoming roadmap milestones strengthen that thesis. The planned Aster Chain mainnet in Q1 2026 introduces staking, privacy features, and broader chain expansion. Each addition increases the ways value can circulate back into the ASTER token rather than leaking outward.
ASTER price does not need hype to move if fundamentals and structure stay aligned. The chart suggests a market preparing for expansion rather than collapse, while CZ fan Daivik’s analysis frames $10 as a scenario built on adoption math, not wishful thinking.
Short-term moves may continue to frustrate, especially near resistance zones. Long-term structure paints a picture of a project positioning itself for a larger role in the perpetual market. Curiosity often starts where charts and fundamentals quietly agree, and ASTER appears to be standing right at that intersection as 2026 comes into view.
Subscribe to our YouTube channel for daily crypto updates, market insights, and expert analysis.