
ASTER price is finally breathing again after a rough slide that caught a lot of traders off guard. Aster just went through a sharp 32% correction in only a few days, then snapped back with a quick relief rally that pushed price up about 10% within 12 hours, based on commentary from analyst Ardi (@ArdiNSC).
That kind of bounce can look like a trend reversal at first glance. The chart tells a more cautious story, especially once you zoom out and focus on the key levels Ardi keeps coming back to.
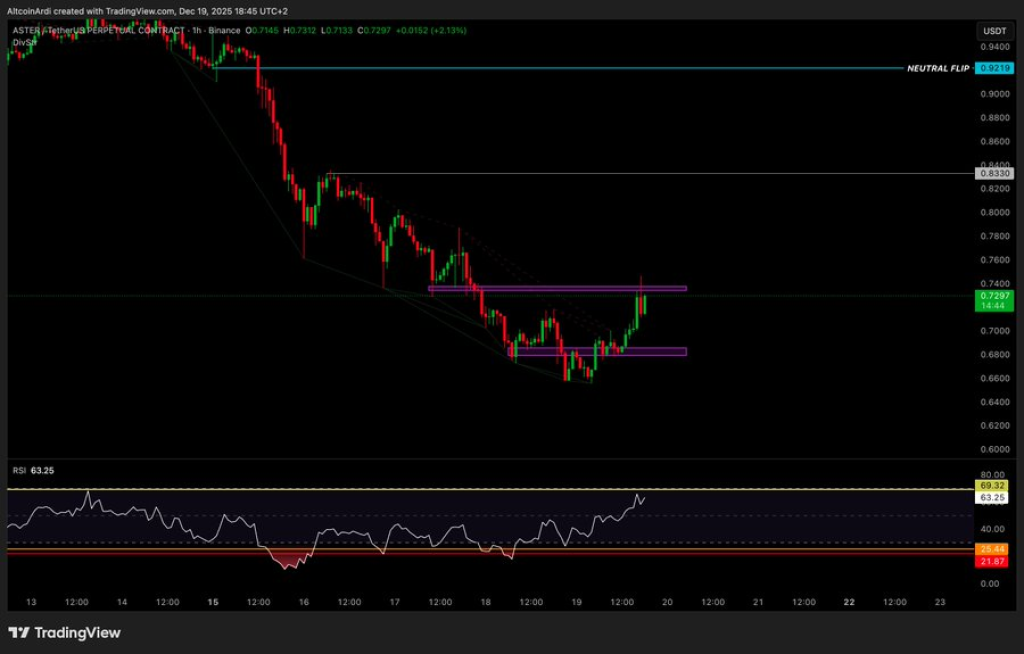
Aster price had been falling hard after rejecting near $0.98. The TradingView chart shows a steady stair step lower, followed by a deeper flush into the mid $0.60s before buyers finally stepped in and pushed ASTER price back toward the low $0.70s.
Ardi describes this move as a relief rally off the lows, driven largely by knife catchers jumping in after the flush and late shorts getting squeezed as price rebounded. That framing fits what the chart is showing. Red candles dominated the earlier part of the move down, then a string of stronger green candles appeared once the bounce started, lifting Aster price into a more crowded zone.
ASTER Price Chart Shows The First Wall Sitting Right Above Current Levels
The most important thing the chart shows right now is where this bounce is running into friction. ASTER price is trading around $0.72 to $0.73 on the screenshot, and it is already pressing into a marked overhead area that has acted like resistance recently.
That overhead zone matters because relief rallies often stall at the first clean supply area, then either roll over into another leg down or pause into a slower consolidation. Ardi’s macro expectation leans toward that first scenario unless the structure breaks in a meaningful way.
Price can still push higher from here, yet the chart is making it clear that Aster price is not moving through empty space. Every step up runs into prior breakdown zones where sellers previously showed up.
Ardi’s roadmap focuses on a reaction from local lows into a higher resistance band from $0.79 to $0.83, where he expects a lower high to form. The chart supports that idea by highlighting $0.83 as a clear reference level above the current price action.
A lower high is a common feature in downtrends. ASTER price can rally hard, look convincing, and still remain inside a broader bearish structure if it fails to reclaim the major levels that defined the earlier breakdown. That is why the bounce alone does not automatically flip the trend.
Momentum on the RSI also hints at the same story. RSI on the chart is around 63, which shows improving strength compared to the oversold dip earlier, yet the reading still sits below the typical extreme zone that often shows up during full trend reversals.
ASTER Price $0.92 Neutral Flip Is The Detail That Could Change Everything
Ardi calls $0.92 the most significant level on the chart, labeling it a neutral zone that would shift the bias if reclaimed. The chart marks that area clearly with a “Neutral Flip” line near $0.92, sitting well above current price.
That gap is the detail many traders miss when they only focus on the bounce. ASTER price can jump 10% and still be far from the level that would actually change the broader structure. Ardi notes there is roughly a 20% spread between current price and that neutral flip zone, which keeps bears in control until proven otherwise.
Read Also: ADA Holders Foot the Bill as Cardano Bets Treasury on Midnight Network
Ardi also ties his trade plan directly to that line. A recapture of $0.92 would invalidate his short thesis enough for him to close his short from $0.98. Anything below that level keeps the door open for him to treat rallies as potential opportunities to add, until a structural break shows up.
ASTER price looks stronger today than it did during the flush, yet the chart makes the real challenge obvious. Aster can bounce, consolidate, or even push into the next resistance zone, but $0.92 remains the line that would truly change the bigger picture. Curiosity now shifts to whether this relief rally turns into a cleaner base, or whether the trend pulls price back down again.
Subscribe to our YouTube channel for daily crypto updates, market insights, and expert analysis.