
Aster price has been moving in a way that feels familiar to anyone who has been watching it closely over the past few weeks. The sharp drop from the highs, the bounce that followed, and the recent hesitation around key levels all seem to trace a path that was already sketched out earlier. One analyst, Ardi also known as @ArdiNSC, laid out that roadmap back in December, and his latest update suggests that ASTER price is still walking along that same line.
The attached chart helps put that idea into context, showing how recent candles line up with the levels Ardi highlighted long before this week’s move unfolded.
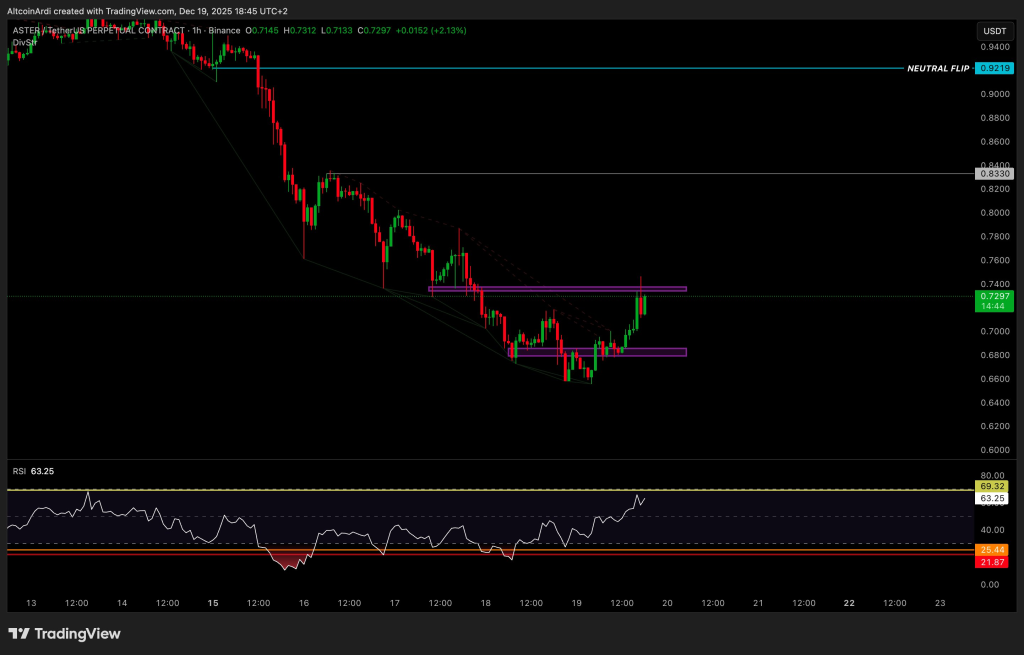
Ardi’s December post described a brutal 32% correction from the $0.98 area, followed by a relief rally off the lows. That is exactly where the story began for Aster. The chart shows a steep sell off that pushed ASTER price down hard, shaking out momentum before buyers stepped in.
That bounce did not come out of nowhere. Relief rallies often appear after fast drops, especially when price reaches areas where selling pressure temporarily dries up. On the chart, that reaction is clear as price stabilizes and starts climbing away from the lows, creating the first leg of the move Ardi described.
What you'll learn 👉
Aster Price Pushed Into The $0.79 To $0.83 Overhead Zone And Set A Lower High
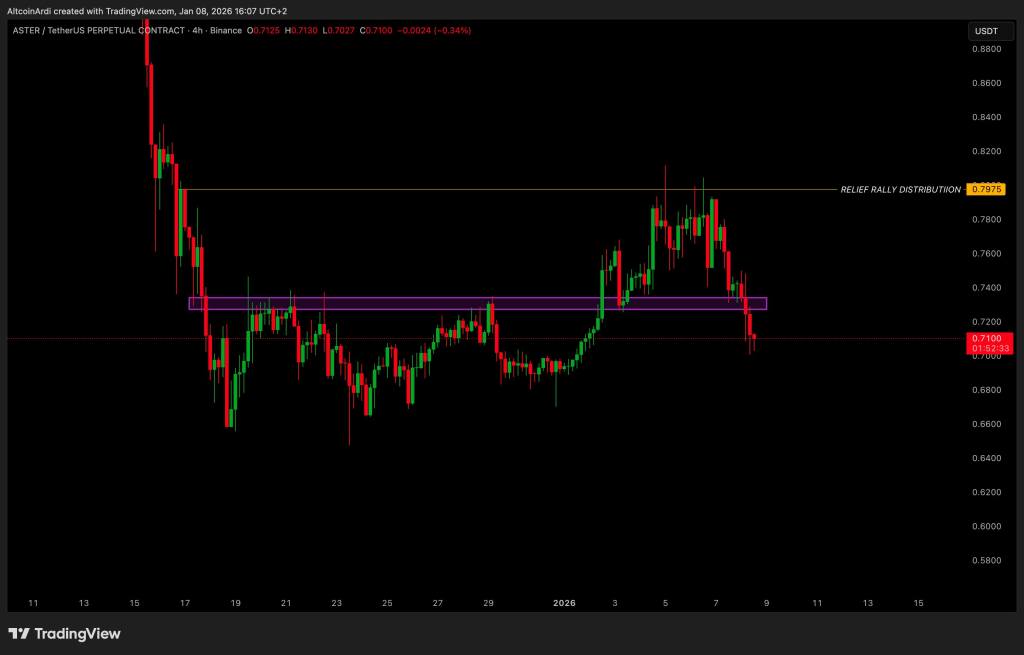
The next part of Ardi’s roadmap focused on an overhead zone between $0.79 and $0.83. The chart highlights this area clearly, with price pushing into that range and struggling to move beyond it. Candles cluster below the zone, showing hesitation rather than strength.
This behavior matters because it frames the rally as corrective rather than the start of a new uptrend. Aster price did bounce, yet the inability to reclaim higher levels turned that bounce into a lower high. The chart visually reinforces this idea by showing how price rolled over after testing that overhead region.
The Chart Shows Key Support Being Tested Near The Range Lows
After failing to hold above the overhead zone, ASTER price started drifting back down. The purple highlighted area on the chart marks a support region that previously acted as a base during consolidation. Recent candles show price slipping back into that zone and pressing against it.
This is where Ardi’s second post becomes especially relevant. He explained that from the lower high, price either resumes the macro flush or settles into consolidation near the range lows. The chart suggests that ASTER price is now at that decision point, with sellers pushing price toward support while buyers attempt to defend it.
Ardi’s base case remains clear. His latest post points to a possible sweep of the macro low near $0.61 if support fails. The chart does not show that level being reached yet, yet the structure explains why it remains on the table.
Price sits below major resistance and has not reclaimed the neutral zone Ardi identified earlier near $0.92. Without that reclaim, the broader structure stays fragile. The steady pressure toward lower levels on the chart supports the idea that downside risk has not disappeared, even if short-term consolidation develops first.
Aster Price Structure Still Follows The Original Thesis
What stands out most is how closely current price action mirrors the December thesis. The relief rally, the push into overhead resistance, and the retreat back toward range lows are all visible on the chart. ASTER price has not done anything dramatic outside that script.
Read Also: How Much Will XRP Be Worth at the Bitcoin, Silver, or Apple Market Cap?
That alignment does not guarantee what happens next, yet it explains why Ardi continues to reference the same roadmap. The chart attached makes his second post easier to understand, showing that the market has respected those levels step by step rather than randomly.
Aster price now sits in a quiet but important phase. The coming sessions will show whether consolidation holds near support or whether the broader flush Ardi outlined continues to unfold. Either way, the chart suggests that this story is still being written, and the next chapter may arrive sooner than many expect.
Subscribe to our YouTube channel for daily crypto updates, market insights, and expert analysis.