Artificial Superintelligence Alliance (FET) Price Is Flashing Strength – Here’s What Could Happen Next

The Artificial Superintelligence Alliance (FET) price is finally waking up again, and the chart is starting to look much cleaner than it has in weeks.
FET is sitting around the mid-0.33 area, and for the first time in a while, the lower, mid, and higher timeframes are all pointing in the same direction. That alone is getting traders’ attention.
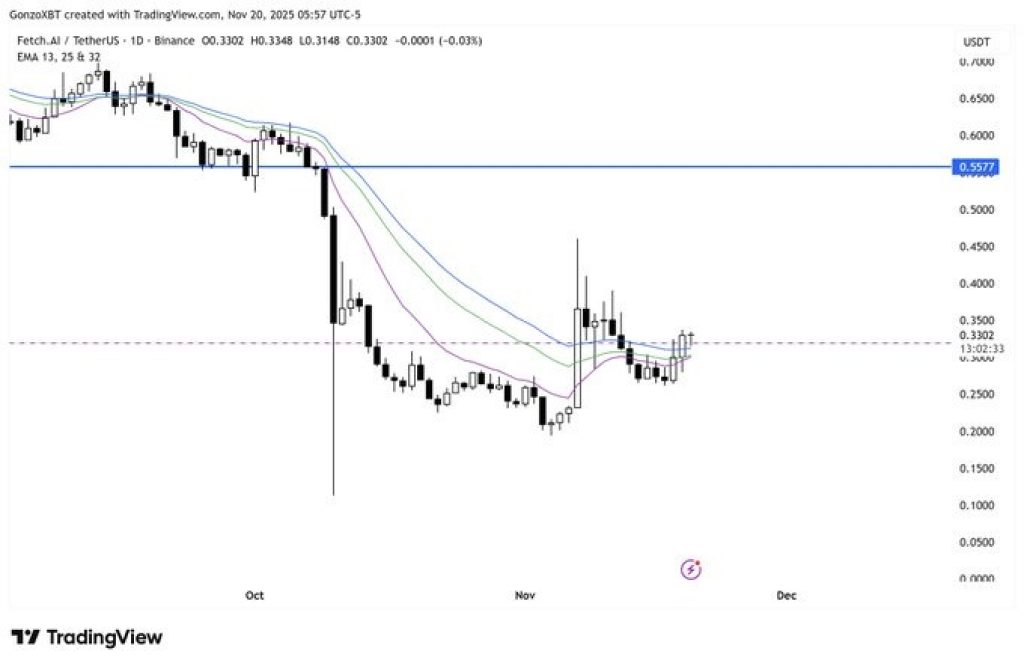
Gonzo, who has been tracking this setup closely, noted that the FET price has now reclaimed its daily trend levels.
On the daily chart, price is pushing back above key moving averages, and the next major target is the zone around 0.5577. That area acted as a strong reaction point earlier in the year, so a move toward it would fit perfectly with the current recovery.
Here’s What FET Chart Is Showing
On the daily timeframe, the FET price finally broke above the trend structure that has been holding it down for most of November.
Holding above the shorter EMAs is usually a sign that a real trend shift is forming, not just a quick relief bounce. If the market stays steady, this could become the base for the next bigger move, especially with the next targets sitting higher up around the MA100 and EMA200.
Read Also: SEI Might Become the Next Big Chain: New Data Reveal What’s Coming
Moreover, the 4-hour setup looks even more interesting. Price is squeezing tightly between support and the longer trendline, forming a clean compression pattern.
These usually resolve with a sharp move once the pressure builds enough. As long as the FET price stays above the short-term trend line, the structure remains bullish. A clean break above 0.34 could be the spark that starts the next run.
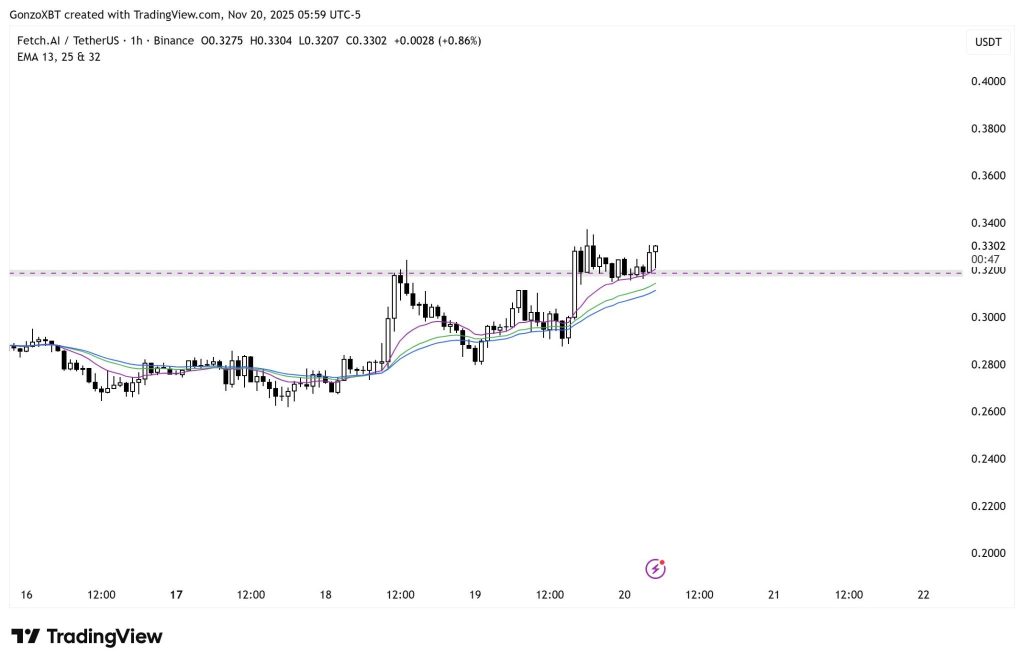
On the 1-hour chart, FET is sitting right on a solid support-turned-resistance zone, and buyers keep defending it. The EMAs are stacked up in bullish order too, which helps keep the short-term trend pointing upward.
Read Also: Here’s the XRP ETFs Status Update – The Real Facts
What Could Happen Next For FET Price
At this point, everything depends on Bitcoin staying calm. Gonzo was clear about that. FET looks strong across all timeframes, but a sudden Bitcoin move can still interrupt things.
If Bitcoin doesn’t cause trouble, the FET price has room to push toward the higher moving averages on the daily chart and possibly even revisit the 0.50 zone. The setup is tightening, momentum is returning, and the levels above are not far away.
Right now, the chart is showing more strength than it has in weeks – and if it holds, the next breakout might be closer than people think.
Subscribe to our YouTube channel for daily crypto updates, market insights, and expert analysis.