Artificial Superintelligence Alliance (FET) Price Analysis: Liquidity Clusters Point to a Volatile Move Coming

The FET price has been stuck in a tight range for most of the day, but the heatmap is painting a much more interesting picture behind the scenes.
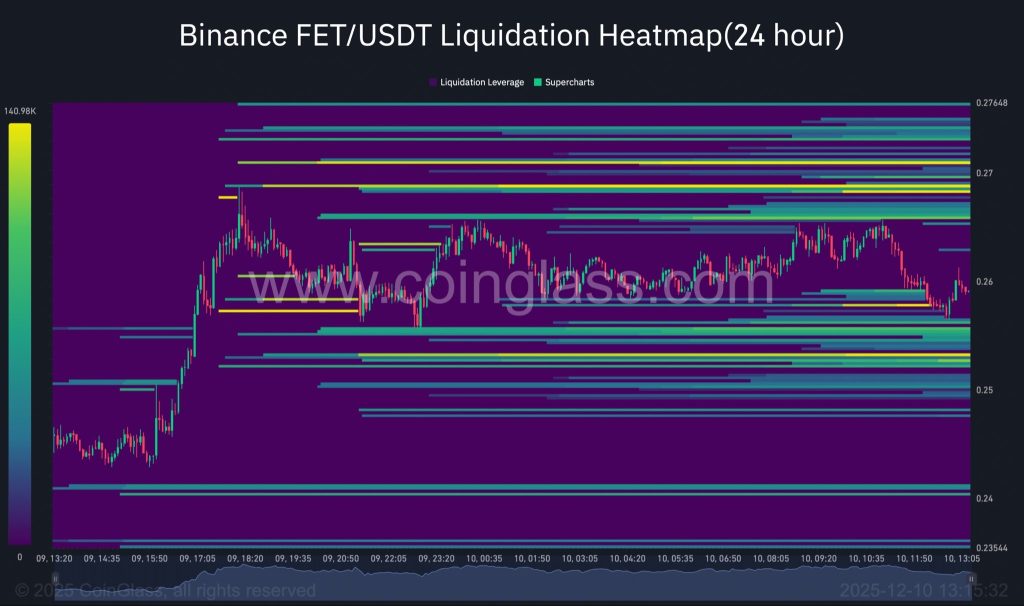
As analyst Amaryllis pointed out, liquidity is piling up on both sides of the chart, and when that happens, markets rarely stay quiet for long.
The latest Binance heatmap shows strong pockets of liquidity forming right underneath the current price, and that kind of setup usually means volatility is brewing.
What you'll learn 👉
FET Heatmap Shows Heavy Liquidity Under $0.255
The heatmap chart shared by Amaryllis makes one thing obvious: the biggest liquidity walls sit between $0.255 and $0.25.
Every time the FET price dips, wicks stab into that zone and get bought up quickly, a sign that late longs are being hunted while larger players reload quietly.
This is classic behavior before a bigger move. When liquidity keeps pooling below price, it often means the market is clearing out leverage before deciding on direction.
Sellers still have the near-term edge, though, as they’ve managed to defend resistance and keep buyers from gaining any real momentum.
Thin Upside Liquidity for FET Could Trigger a Squeeze
Above $0.265–$0.27, liquidity thins out dramatically. That’s unusual unless traders are heavily leaning one way, in this case, still favoring shorts or cautious longs.
A thin liquidity zone on the upside means one thing: if the FET price breaks into it, the move could be fast. There aren’t many orders sitting there to slow it down. Short squeezes often begin in exactly this kind of environment.
For now, though, sellers still control the flow, and FET hasn’t shown the kind of strength needed to flip the short-term trend.
What’s Next for FET?
The heatmap shows compression everywhere. Liquidity is stacking closer to the FET price, dips are being absorbed quickly, and both sides are preparing for a breakout. When this happens, markets rarely stay calm.
All eyes are now on two zones: the liquidity shelf around $0.25 below, and the $0.27 area above. Whichever one price taps with momentum first will likely decide the next direction for FET.
Until then, this is a waiting game. The chart is clearly coiling, and the heatmap is signaling that volatility isn’t just possible, it’s coming.
Subscribe to our YouTube channel for daily crypto updates, market insights, and expert analysis.