
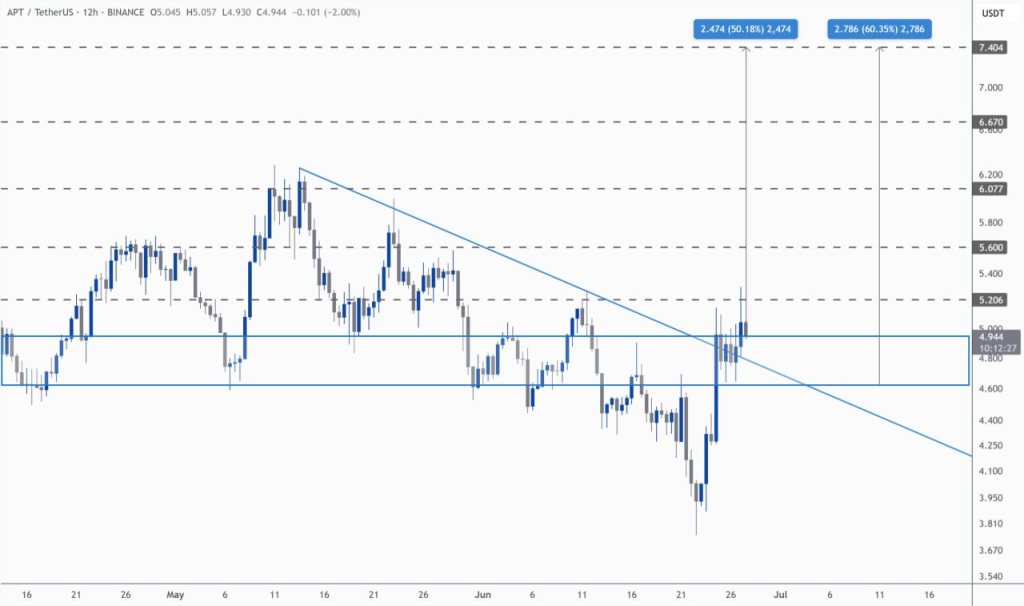
Aptos price action is looking quite strong right now according to analyst CryptOpus. In his chart, you can see how APT price has managed to break above both a descending trendline and a horizontal resistance area around $4.90 to $5.00. CryptOpus pointed out that this move puts APT price in a bullish position because these levels had been capping upside attempts for weeks.
The chart shows that Aptos price spent most of June trapped below the blue horizontal box, bouncing back and forth without strength. But after a sharp rally, the price pierced through the descending trendline and closed above the horizontal resistance. This breakout suggests that Aptos might be ready for a larger move up, especially if this area can now hold as support. CryptOpus shared targets near $7.40 and $6.67, which would mean gains of about 50% to 60% from the current Aptos price.
APT Price Bounces from Multi-Year Support
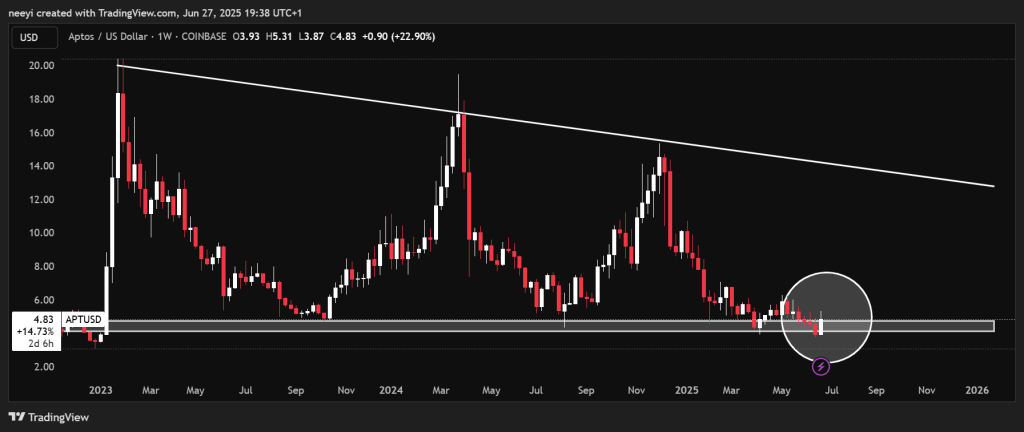
The longer-term weekly chart tells a similar story, but from a bigger perspective. The Aptos price has been testing a multi-year support zone that has held strong since early 2023. Each time the APT price touched this area, it quickly rebounded. Although there were a few brief breakdowns below the support, none of them led to a decisive move lower.
Yesterday, Aptos price dipped below this zone again but snapped right back up, and now it is trading above the key horizontal area around $4.90. This bounce makes it look like buyers are defending this support once more. If Aptos price can keep this level as support in the coming days, the next midterm target will likely be the long-term descending trendline shown on the weekly chart. This trendline has been acting as resistance since Aptos peaked near $20, and reaching it would signal a shift in market sentiment.
Here’s the Outlook for APT
Overall, both the short-term and long-term charts for Aptos price are pointing toward a potential breakout. On the 12-hour chart, the recent move above resistance shows strength. On the weekly chart, the consistent defense of multi-year support suggests the downside may be limited. If the Aptos price can flip this $4.90 zone into support, it opens the door for a rally toward the descending trendline near $7 or higher.
Read Also: Analyst Sees JasmyCoin Price Sliding Lower: How Bad Could It Get?
With these technical signals lining up, Aptos looks like it could finally break out of its long bearish trend if bulls can keep momentum going.
Subscribe to our YouTube channel for daily crypto updates, market insights, and expert analysis.