
Aptos has been going through a rough patch lately, but things might be looking up. After sliding downward for a while, the token seems to have hit a solid floor where buyers are stepping in.
Market watchers think this could be the turnaround point they’ve been waiting for – though as with anything in crypto, nothing’s set in stone. The shift in momentum has attracted interest, especially from traders who’ve been tracking Aptos’s ups and downs.
Crypto analyst Nilesh Rohilla highlighted APT’s recent price movements, noting that the token initially formed a descending triangle before breaking below support.
But buyers intervened in the $4.30–$4.50 region, causing a reversal. The price turned earlier obstacles into support when it passed resistance levels, indicating fresh bullish momentum.
📊 $APT Technical Analysis (4H Chart ) 🚀
— Nilesh Rohilla | Crypto Analyst (@nilesh_rohilla) February 20, 2025
1️⃣ Trend Breakdown & Recovery$APT initially formed a descending triangle, leading to a sharp breakdown below support.
Price found a strong demand zone near $4.30-$4.50 and reversed upwards.
After breaking out of the falling wedge, $APT… pic.twitter.com/u4FTYSelBE
APT, at press time, is trying to strengthen its position above important support zones by trading around $6.27. Rohilla determined that $7.50, $9.00, and $12.50 as resistance, while $6.50 and $5.80 are critical levels that now work as supports. If market conditions stay positive, a breakout over $7.50 might lead to a bigger rise toward the $10–$12 level.
What you'll learn 👉
Aptos Technical Indicators Suggest Mixed Signals
Several indicators provide insight into APT’s potential trajectory. The RSI currently stands at 44.67, hovering in a neutral-to-bearish zone. Even though the metric has recovered from oversold circumstances, it is still below the crucial 50-point mark, indicating that more confirmation is needed for bullish momentum.
Bollinger Bands analysis reveals a narrowing range, indicating reduced volatility. The price recently bounced off the lower band, hinting at a potential mean reversion toward the middle band, which sits around $6.69. A breakout past this level could strengthen the short-term bullish case, targeting the upper band near $8.00.
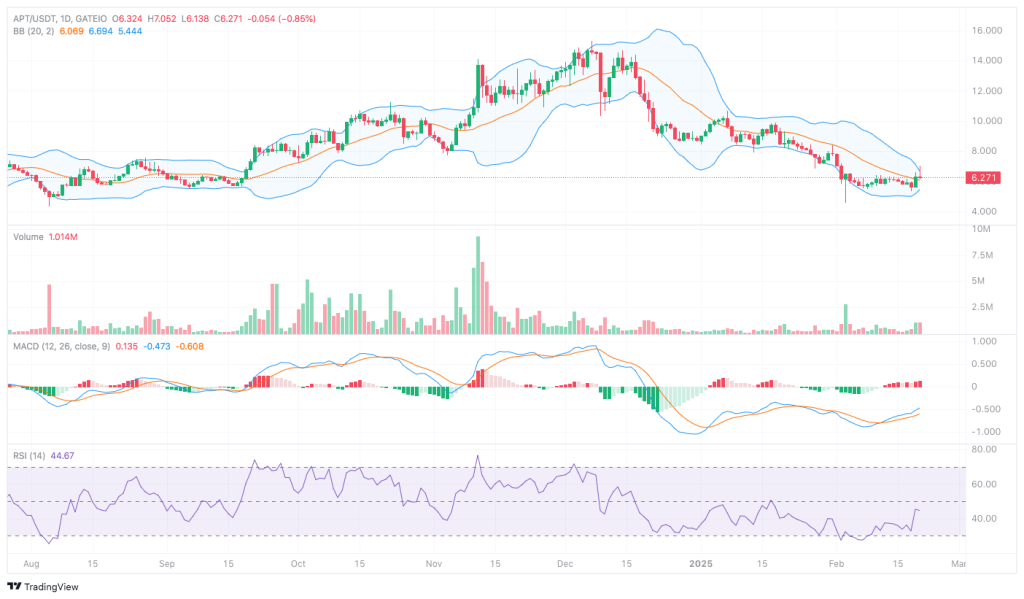
Meanwhile, the MACD shows early signs of a trend shift. The MACD line has crossed above the signal line, suggesting a possible transition from bearish to bullish territory. However, a lack of strong volume casts uncertainty over the strength of this reversal.
Read also: Pi Network (PI) Dips 60% After Launch—And It Could Get Worse: Here’s Why
APT Market Outlook: Reversal or Consolidation?
APT’s market position remains at a crossroads. Rohilla emphasized the importance of maintaining support at $6.50 while eyeing $7.50 as a key breakout point. If the token sustains momentum and surpasses resistance levels with volume confirmation, a run toward $10-$12 is plausible.
On the other hand, if $6.00 is not maintained, more downward pressure may be invited; possible support may appear between $5.40 and $4.80. A RSI drop below 40 and a drop in buying volume would support a bearish outlook and raise the possibility of a retest at lower levels.
Key resistance flips and higher lows are helping Aptos transition from a downtrend to a bullish pattern. While indicators point to a possible recovery, confirmation through increased volume and a decisive break above $7.00 remains crucial. If market conditions align, APT could move toward double-digit price levels in the coming sessions.
Follow us on X (Twitter), CoinMarketCap and Binance Square for more daily crypto updates.
Get all our future calls by joining our FREE Telegram group.

We recommend eToro
Wide range of assets: cryptocurrencies alongside other investment products such as stocks and ETFs.
Copy trading: allows users to copy the trades of leading traders, for free.
User-friendly: eToro’s web-based platform and mobile app are user-friendly and easy to navigate.