Analyst Updates JasmyCoin (JASMY) Price Forecast as He Spots Final Surge – Here’s What the Chart Shows

JasmyCoin price is showing bullish momentum on its 4H chart, with price action reflecting a structured climb since June.
Amid this movement, veteran financial trader Matthew Dixon shared his analysis, suggesting JASMY is now in a minor correction before one final push higher. His tweet has brought renewed attention to the token’s short-term trend and technical setup.
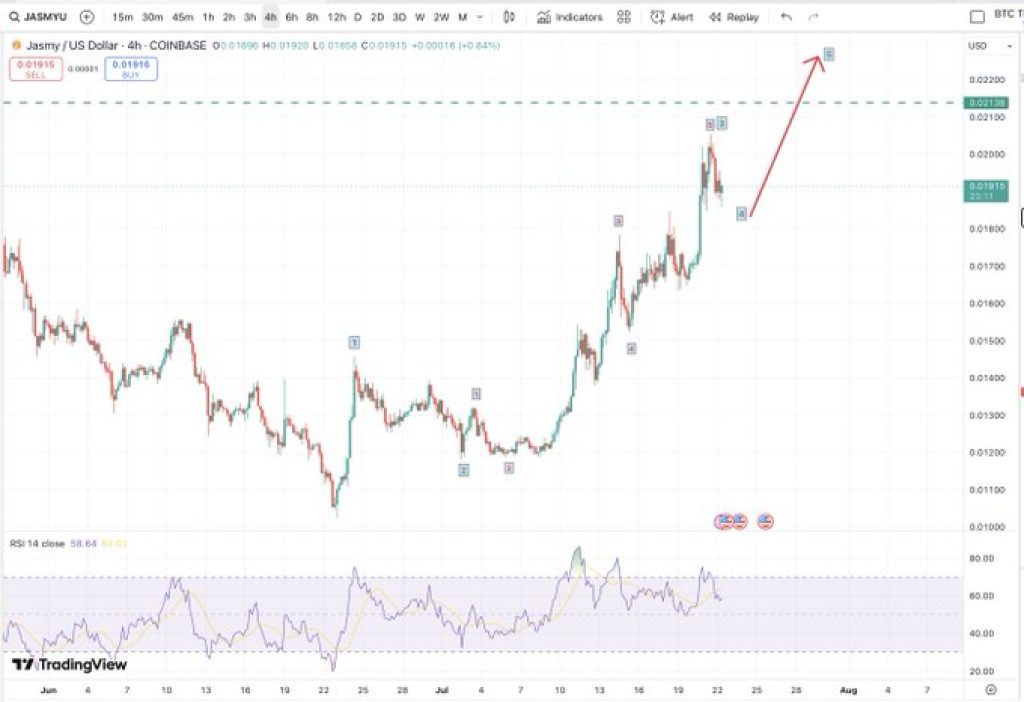
Dixon’s view aligns with the current chart pattern, which reveals a classic five-wave formation. According to his forecast, the final leg of this impulse could push JASMY to the $0.022 level. However, a correction may follow before a larger bullish cycle resumes.
What you'll learn 👉
Wave Structure Suggests More Upside Ahead For JASMY
The JasmyCoin chart shows a defined upward trend. JASMY price has been forming higher highs and higher lows since mid-June, supported by identifiable Elliott Wave labeling. As of the latest session, the asset is pulling back after touching $0.021, a move that appears to be the fourth wave in the five-wave structure.
This pattern typically signals the continuation of an impulsive bullish cycle. The projected fifth wave could target $0.022 to $0.023, based on the earlier leg sizes and resistance levels. Dixon referred to this move as the completion of the first major impulse, hinting at a broader trend potentially forming on higher timeframes.
Following the fifth wave, Dixon expects a correction. This could present an opportunity for buyers looking to enter on a retracement before a more extended move to the upside begins.
JasmyCoin Key Support and Resistance Levels in Focus
Current resistance sits between $0.0214 and $0.022, where the JASMY price was rejected before the ongoing pullback. This zone serves as the next key level to monitor for a breakout. If price manages to close above this band with volume support, it could confirm the next leg higher.
Meanwhile, support around $0.0186 is holding the present correction. This level coincides with the top of the third wave and may act as a local base if buying pressure increases. A broader support zone exists near $0.0165, a former consolidation area that could offer stability in case of a deeper retracement.
Moreover, the Relative Strength Index (RSI) on the 4H chart is hovering between 68 and 70. This places the token near overbought territory, which aligns with the minor cooldown in price. Previous RSI peaks around this range marked short-term tops, but the current value suggests momentum remains intact.
If RSI dips slightly during this correction but stays above 50, it would support the case for continued strength. A rebound in RSI paired with renewed buying activity could confirm the fifth wave extension.
Read Also: Analyst Predicts Hedera (HBAR) Price Could Rally to $1 – Here’s the Key Level to Watch
JASMY Price Outlook Supported by Market Structure and Expert Commentary
Matthew Dixon’s assessment points to a textbook Elliott Wave development. His expectation of a near-term move higher, followed by a corrective phase, is consistent with technical norms. The chart structure and RSI behavior also align with his analysis.
While the $0.022 target is the immediate focus, traders are also preparing for a potential retracement after the impulse wave completes. The next movement will likely depend on volume and overall market conditions. Both the wave structure and RSI suggest a possible continuation, but confirmation is still required.
JASMY price remains in a short-term uptrend with defined targets, as long as support levels continue to hold. Dixon’s update reinforces the current technical narrative, offering traders a structured view of potential outcomes over the coming sessions.
Subscribe to our YouTube channel for daily crypto updates, market insights, and expert analysis.