
The price action of Render has drawn comparisons to its 2021 cycle, sparking discussions about potential future movements. A recent analysis suggests that RENDER’s price may be forming a similar pattern to its previous market cycle, with key resistance and support levels determining its next move.
Prominent analyst Hansum highlighted these similarities on X, emphasizing that $4.00 needs to be reclaimed for bullish momentum and that a break above $7.00 would invalidate the bearish outlook. The chart analysis provides further insight into these price levels and their impact on future trends.
What you'll learn 👉
Render Price Trends and Key Support Levels
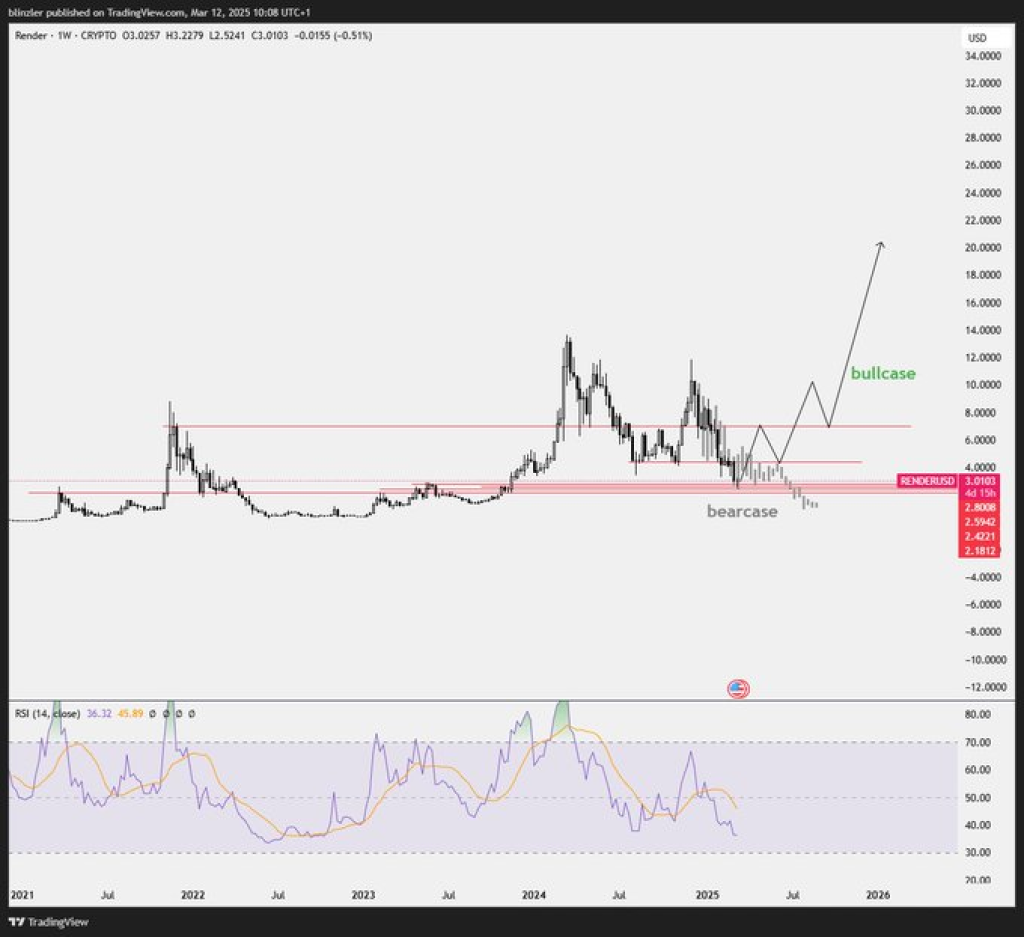
The token has shown a pattern of ups and downs, with big jumps in 2021 and 2023, then dropping afterward. Right now it’s around $3.01, sitting on solid support between $1.80 and $2.50. This range has been a starting point for price increases before, which makes it important to keep the price stable.
If RENDER’s price remains above this support range, there is potential for a reversal. However, a breakdown below this zone could lead to further declines. Analysts observe that the $4.00 resistance level is a key threshold – regaining this level could indicate a shift toward an upward trend.
Render Resistance Levels and Potential Breakout
The $4.00 resistance level has been identified as an essential point for bullish momentum. If RENDER’s price surpasses this mark, it could trigger a higher low formation, signaling trend reversal. The next resistance level at $7.00 serves as the bullish invalidation point. If the price moves beyond this, it could open the path to a rally toward $16-$20.
Failure to reclaim these resistance levels may keep the bearish scenario intact. If RENDER remains below $4.00, there is a risk of continued downward movement, with price action revisiting lower support zones.
Read Also: Celestia (TIA) Price Breaks Out: ~100% Rally Next? Here’s the Outlook
RENDER Market Indicators and Future Projections
The RSI remains below 50, reflecting weak momentum. Historically, previous oversold conditions have preceded strong recoveries, making RSI a metric to monitor. A bounce from current levels could support a bullish reversal, while further weakness may prolong the downtrend.
The chart structure suggests a potential bottoming pattern, mirroring historical movements from previous cycles. If the current trend follows past behavior, the price of RENDER may see a gradual accumulation phase before an upward breakout.
Subscribe to our YouTube channel for daily crypto updates, market insights, and expert analysis.

We recommend eToro
Wide range of assets: cryptocurrencies alongside other investment products such as stocks and ETFs.
Copy trading: allows users to copy the trades of leading traders, for free.
User-friendly: eToro’s web-based platform and mobile app are user-friendly and easy to navigate.