You might have wondered how high Ripple price can go based on different scenarios. One of the best places to look is the XRP chart. Technical analysis can give us a picture of what to expect in the future, and that’s exactly what an analyst on X shared earlier today.
Amonyx (@amonbuy) shared a chart that could spark optimism in the XRP community. According to him, “There is nothing stopping $XRP reaching $20+ now. It’s inevitable.” The chart he posted makes a bold case for why Ripple price could explode in the coming months, and if the patterns hold, the next major wave could push XRP price toward that $20 mark and possibly beyond.
What you'll learn 👉
A Classic Elliott Wave Pattern With XRP Price History on Its Side
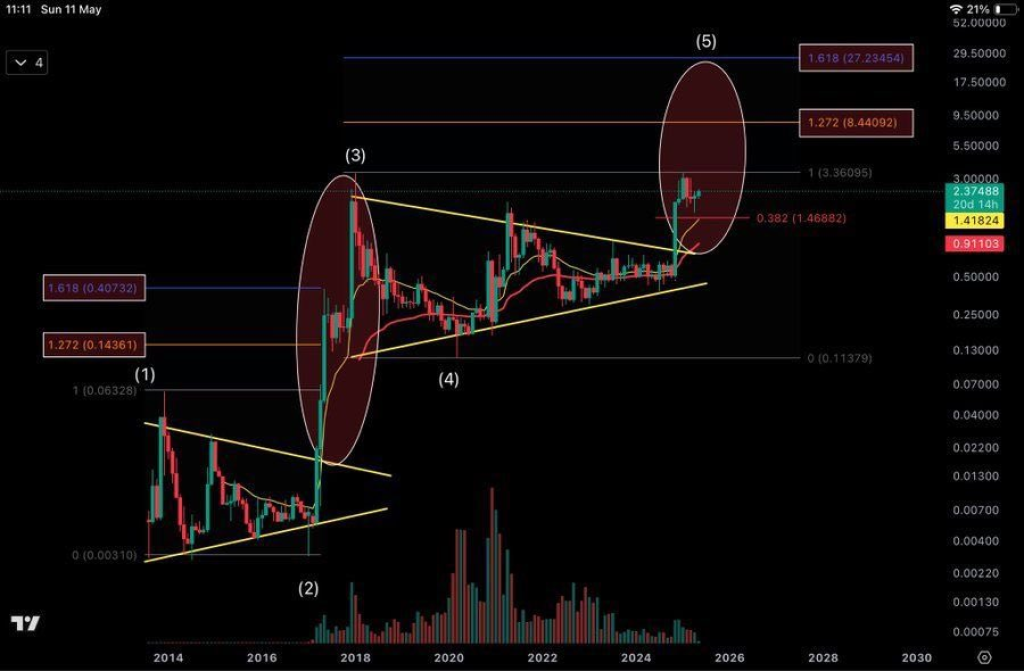
The chart is built around an Elliott Wave structure, showing five major cycles in XRP price movement stretching from 2014 to the projected 2026 rally. According to Amonyx, XRP is currently in the early stages of wave (5), which historically tends to be the strongest and most euphoric leg of any bullish sequence.
The past waves support this. Wave (1) took XRP from below $0.01 to around $0.06. After a brief correction in wave (2), XRP surged in wave (3) , this was the 2017 bull market when XRP exploded from just under $0.01 to around $3.50. That was followed by a long corrective wave (4), lasting several years.
What’s significant here is how wave (4) formed a massive bullish wedge: a classic consolidation structure. XRP broke out of this wedge just recently, and now the same explosive move seen in 2017 is starting to repeat.
Ripple Price Fibonacci Targets Point to $8 and Even $27
One of the strongest arguments on Amonyx’s chart is the use of Fibonacci extensions. These are not random numbers, they are common targets used by technical traders to predict future price expansions.
For XRP, the 1.272 Fibonacci extension lines up at $8.44, and the 1.618 extension is all the way up at $27.23. These levels are drawn based on the size of the previous waves, especially the massive rally during wave (3). The logic is simple: if history rhymes and XRP follows a similar pattern again, then hitting between $8 and $27 is not just possible, it’s expected.
At the time of his post, Ripple price is hovering around $2.37. That puts the lower Fibonacci target at roughly a 3x from current levels, and the upper target at more than 10x. This projection doesn’t feel like speculation if you take into account the similar triangle breakout from 2017 and the overall structure of the pattern.
Read Also: Ripple (XRP) Price Is Acting Strange: Is It Being Manipulated?
The chart also shows XRP holding strongly above the 0.382 Fibonacci retracement level at around $1.46, which is often considered a healthy support zone in bullish setups. As long as the price stays above this range and consolidates, the conditions remain strong for an explosive rally.
While no chart guarantees the future, what Amonyx presents is a pattern-based thesis backed by historic price action, reliable Fibonacci targets, and a structure that resembles one of the most explosive chapters in Ripple’s history. If this setup plays out as it did before, XRP price moving toward $20 or even $27 is not only possible, it might just be the next big crypto story to watch.
Subscribe to our YouTube channel for daily crypto updates, market insights, and expert analysis.

We recommend eToro
Wide range of assets: cryptocurrencies alongside other investment products such as stocks and ETFs.
Copy trading: allows users to copy the trades of leading traders, for free.
User-friendly: eToro’s web-based platform and mobile app are user-friendly and easy to navigate.