What if the next big move in crypto isn’t about Bitcoin breaking new highs, but about altcoins quietly stealing the spotlight? Signals pointing to Altcoin Season have been stacking up, and some charts look familiar to the setups that came before explosive rallies in past cycles.
Between Bitcoin price trends, BTC dominance shifts, and even a rare Bitcoin versus Gold signal, the stage might be set for another rotation moment that traders call Altseason.
What you'll learn 👉
Index Showing Deep Altseason Territory
Bitcoinsensus, a crypto analyst on X posted that the Altcoin Season Index has been sitting in deep altseason territory for more than a week. The Index measures how much altcoins are outperforming Bitcoin. When that gap widens and stays wide for days, it suggests capital is shifting into altcoins instead of staying with BTC.
Explaining why this matters requires a simple mental picture. Picture a crowded beach. Bitcoin acts like the ocean tide. Altcoins behave like sandcastles built on that sand. When the tide pulls back slightly and the sand dries, sandcastles get built faster. The Index showing sustained altcoin strength suggests builders are active now.
The analyst explains that this metric does not promise anything guaranteed. Index readings have moved before only to reverse. Observation of an extended run in altcoin outperformance matters because it changes how traders and allocators view risk and rotation. That can affect BTC price indirectly.
Bitcoin Dominance Death Cross Suggesting Rotation Toward Alts
Ito Shimotsuma, a crypto commentator on X, flagged a rare death cross in Bitcoin dominance. The signal appears once per cycle and showed up in 2016 and 2021, according to Ito.
Both past occurrences coincided with big moves for altcoins. The idea is simple. Lower Bitcoin dominance means altcoins gain market share. A death cross of dominance suggests that trend is accelerating.
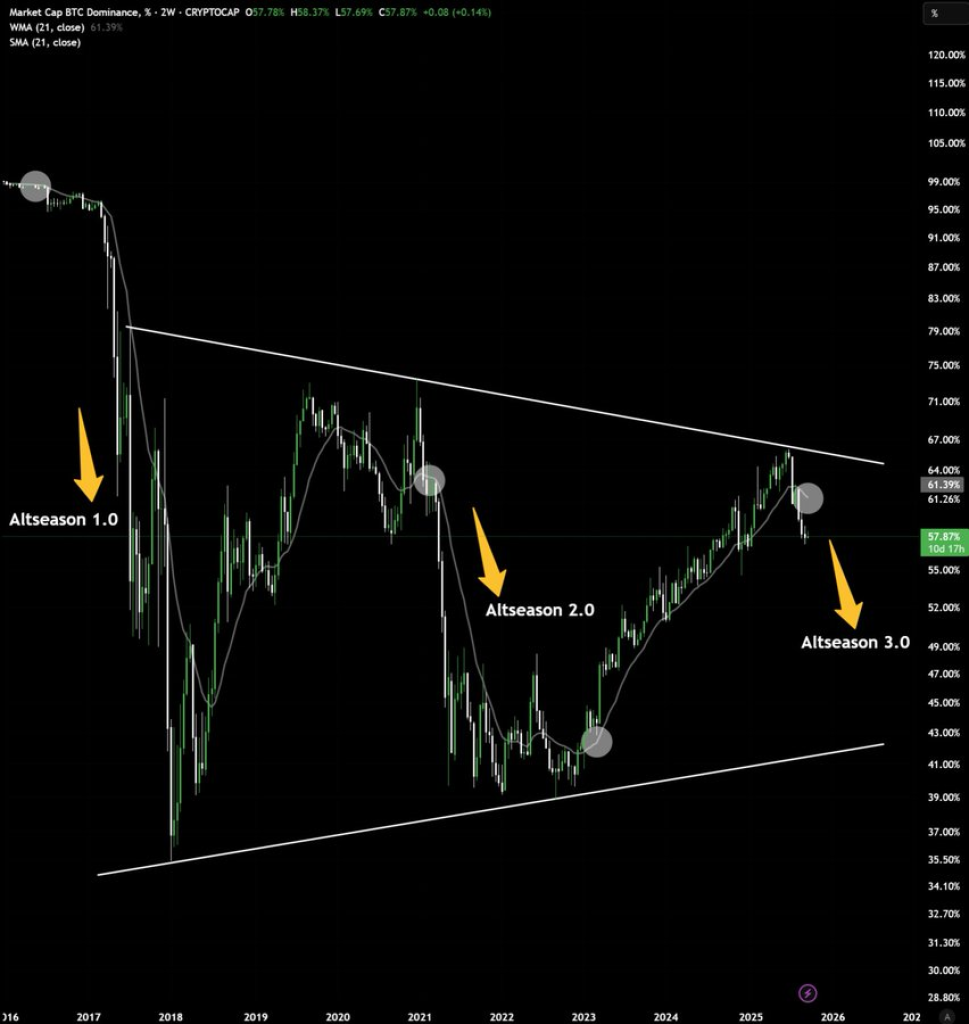
Picture market dominance like a tug of war rope. When BTC dominance loses ground the rope starts to tip toward altcoins. That shift changes how money flows. BTC price can stay stable while altcoins jump, or BTC can give up some gains as capital rotates. Ito frames this as a structural sign more than a short lived blip.
This metric links directly to altseason because dominance measures where market emphasis sits. A rare death cross acts like a road sign that rotation is gaining momentum. Ito’s note comes from a crypto analyst viewpoint focused on structural signals rather than headlines.
Bitcoin versus Gold Trendline Touches in September Have Preceded Altcoin Seasons
A crypto analyst on X called CryptoELlTES pointed to a Bitcoin versus Gold chart and noted a repeating pattern. The chart shows a rising trendline that Bitcoin price has touched at key September points. Each time the touch happened the market moved into phases that favored altcoins soon after.
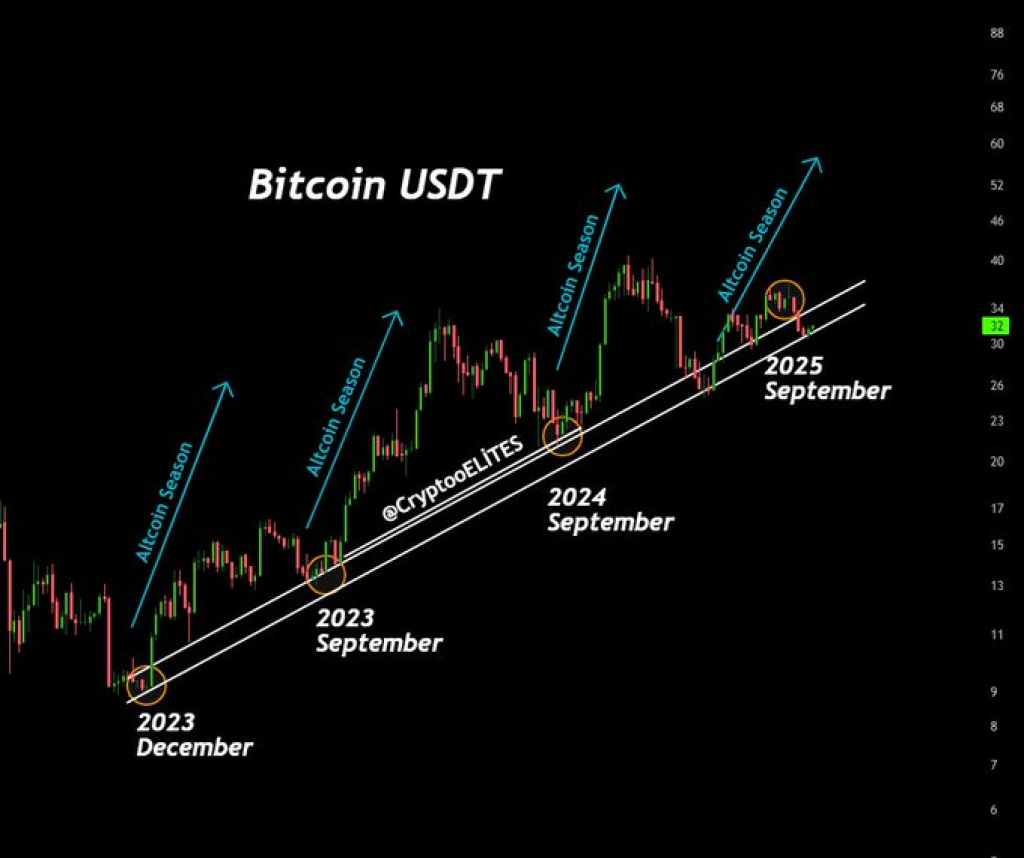
According to the chart by CryptoELlTES, a channel of support runs upward. Small orange circles mark points in September 2023 and September 2024 where Bitcoin met that support. Blue arrows labeled Altcoin Season follow those price peaks. The most recent point sits at a similar place along the trendline. That repeated seasonal timing is what the poster finds interesting.
The Bitcoin versus Gold metric blends macro messaging with technical structure. Gold reference frames a relative valuation story. When Bitcoin holds that trendline against Gold, capital allocation can tilt toward risk assets like altcoins.
Chart details matter. The trendline is part of a clean channel. Each touch acted as a reset before a new altcoin leg. That pattern does not prove a future outcome, but it provides context when paired with the Index from Bitcoinsensus and the dominance signal Ito noted.
What All Three Metrics Together Suggest for BTC price and Altseason
Seeing the altcoinSeason Index in deep territory, a rare dominance death cross and a September trendline touch on the Bitcoin versus Gold chart makes a neat narrative. Each metric looks at the market from a different angle. The Index reads market breadth. Dominance measures allocation shifts. The Bitcoin versus Gold chart ties a seasonal and valuation element together.
Read Also: Pudgy Penguins (PENGU) Rally Picks Up Again: How High Can It Go?
This alignment is like several instruments in an orchestra starting the same tune. Harmony does not guarantee a symphony, but it raises the odds of a coordinated move. BTC price could act as the steady base while altcoins accelerate, or BTC might take a small step back as money rotates. Either way, altseason dynamics may change how gains and leadership get distributed across tokens.
Subscribe to our YouTube channel for daily crypto updates, market insights, and expert analysis.