
Michaël van de Poppe called this an interesting chart, and that description fits perfectly. The altcoin market cap, excluding Bitcoin and Ethereum, is sitting right on a level that really matters.
The market isn’t crashing, and it isn’t collapsing either. We’re seeing a pause, and those pauses do tend to shape what comes next. The vital thing to note, however, is that the uptrend remains intact, provided this support holds.
Read Also: Best Altcoins to Watch Right Now: PEPE, ETH, and More
What you'll learn 👉
What the Weekly Chart Is Telling Us
On the weekly chart shared by Michaël, the altcoin market cap had a strong run through 2024 and into early 2025. After that, momentum slowed and price pulled back into a well-defined support zone. That zone, marked as the “area to hold,” is where the market is currently hovering, around the $878B level.
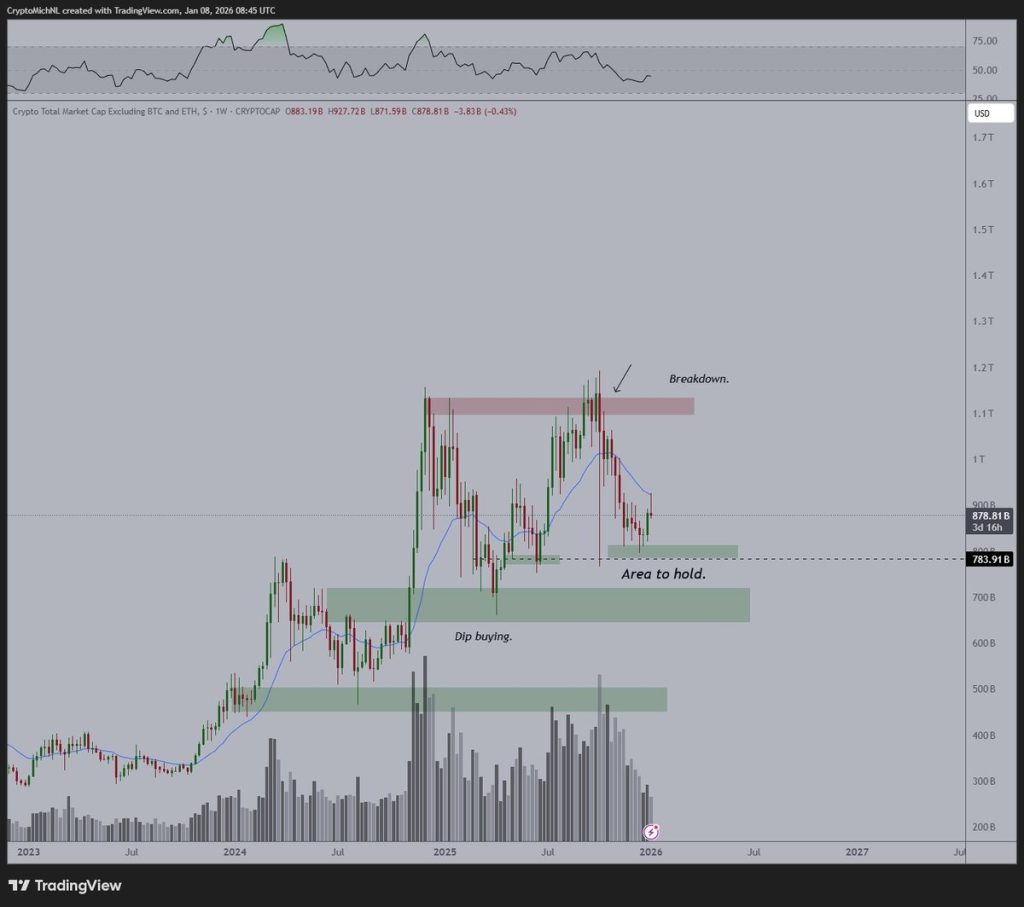
Just below that sits the more critical line near $784B. This is the level that really matters on a weekly close. As long as the market stays above it, the structure remains constructive. This kind of pullback is actually typical in an uptrend, where price pushes higher, pulls back to demand, and then looks for the next attempt higher.
Read Also: Bitcoin, Solana, XRP, Other Altcoins Are Waking Up Again: 5 Reasons the Rally Is Not Over
Why the Rejection at the 21-Week MA Is Normal
The first bounce off support ran straight into the weekly 21 moving average. The price got rejected there and pulled back again, which might feel discouraging if you were expecting a fast continuation. But in reality, this is fairly normal behavior.
When markets fall below a key moving average, they often need time to build strength before they can reclaim it. That rejection also lines up with a previous supply zone, which explains why price stalled there. Nothing about this move looks random.
What Comes Next for Altcoins
If the $784B area continues to hold, the chart leaves room for more sideways action before another attempt higher.
The next major test would be a reclaim of the 21-week moving average and a move back toward the $1T area, which is where the earlier breakdown started.
If support does fail, the next meaningful demand zone sits lower, roughly between $650B and $700B. That zone acted as a dip-buying area before, so it is the next place where buyers would likely step in.
For now, the chart supports van de Poppe’s main takeaway. It is not a breakout yet, but as long as this support holds, the bigger trend for altcoins still points higher.
Read Also: Top Analyst Goes All In on Kaspa (KAS): Reveals Why It Beats Most Altcoins
Subscribe to our YouTube channel for daily crypto updates, market insights, and expert analysis.