The Cardano price is trading at $0.62 after pumping 2.5%. Actually, ADA has been trading sideways in the $0.59 and $0.63 range.
Coinpedia posted a viral Cardano chart and explained what’s going on with the ADA price right now.
What you'll learn 👉
History Repeating? The Descending Trendline Pattern
Looking at the weekly chart, Cardano shows an interesting pattern that might signal a major move ahead. In 2023, ADA was trapped under a descending resistance trendline for months. After several failed attempts, it finally broke through in late Q3 and embarked on a strong bullish run into 2024. This breakout resembled a bullish falling wedge pattern, which typically signals a trend reversal.
Fast forward to now, and we’re seeing a similar setup. After reaching a local high above $1.30, the ADA price has been moving in another descending channel, forming lower highs and lower lows. However, the price action suggests it’s now testing the upper boundary of this trendline again.
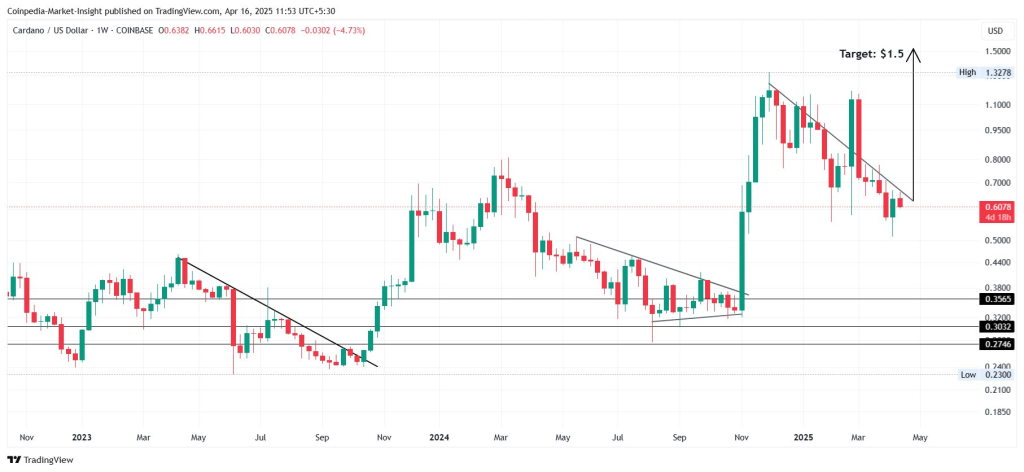
The chart reveals three major descending trendlines. The first from Q1-Q3 2023 was already broken, leading to a significant rally. The second from mid-2024 was also breached, pushing ADA to the $1.30+ high. The third trendline, running from January to April 2025, is currently being tested. A breakout from this level could trigger the next major price movement.
Read also: 100M ADA Offloaded in a Week – Analyst Warns of Potential Cardano Breakdown
Cardano Price Targets
Currently, ADA is sitting just above the $0.60-$0.61 zone, which has flipped into support. If this zone holds, it strengthens the bullish continuation narrative. Below this, the chart outlines three strong historical support zones: $0.3565, which held multiple times in 2023; $0.3032, a strong structural support; and $0.2746, a major low tested multiple times across mid-2023.
Based on previous price action after similar descending trendline breakouts, analysts are eyeing a target of $1.50. The previous breakout from a similar wedge pattern led ADA from approximately $0.30 to $1.30 – more than a 4x gain. A similar move from the current $0.60 level could logically bring the price near $1.50-$1.60.
Looking at the broader context, if this cycle continues to mirror the last one, Cardano could be on the verge of a major move, with April potentially marking the start of something significant. ADA is currently testing resistance-turned-support near $0.60, and a breakout above the current descending trendline could confirm a bullish continuation toward the $1.51 target.
Adding to the technical setup, some analysts point to fundamental catalysts on the horizon. A potential Cardano ETF this year could make ADA more accessible to institutions, potentially increasing demand.
While the pattern looks promising, traders should remember that market conditions can change quickly, and all technical analyses come with inherent uncertainty.
Subscribe to our YouTube channel for daily crypto updates, market insights, and expert analysis.

We recommend eToro
Wide range of assets: cryptocurrencies alongside other investment products such as stocks and ETFs.
Copy trading: allows users to copy the trades of leading traders, for free.
User-friendly: eToro’s web-based platform and mobile app are user-friendly and easy to navigate.