Zcash (ZEC) price action has been unpredictable over the past few months, yet a few chart reads have stood out for their accuracy. Crypto Patel shared one of those reads when Zcash bounced from the $300 to $350 region and climbed toward $450. The move followed his earlier call that highlighted weakness near the $700 to $750 area before ZEC slid toward $300. These two calls created interest in what he would look at next, mainly because the chart has reached another point where the structure needs a clear direction.
The latest update from Crypto Patel centers on the $500 region, and his chart shows why that level matters for both upside continuation and downside risk. The setup now looks like a point where Zcash must break cleanly or give way to another deeper leg, and his explanation provides a simple way to understand that scenario.
What you'll learn 👉
How The Previous ZEC Price Calls Formed The Foundation For This Outlook
Crypto Patel pointed to the earlier drop from the $700 zone toward the $300 zone as a key moment that shaped the current Zcash structure. His chart captured that slide and highlighted how ZEC found support inside the green demand block. The rebound toward $450 unfolded almost exactly as he mapped out, with candles forming a clear higher low and then moving along a short ascending trendline.
Zcash price behavior in this phase created a pattern of measured reactions. The chart shows rising momentum into the mid range, followed by consistent hesitation near the top of the red resistance block. This hesitation played a major role in shaping his next view because the cluster of candles under that region reveals how the market treated that level each time ZEC approached it.
Why The $500 ZEC Price Zone Has Become The Key Resistance
Crypto Patel highlighted the $500 region as the point where ZEC must show conviction. His chart places the red resistance band directly above the current range, and the candles approaching it display shorter bodies and weak follow through. This behavior signals that the level has acted as a ceiling in previous attempts to push higher.
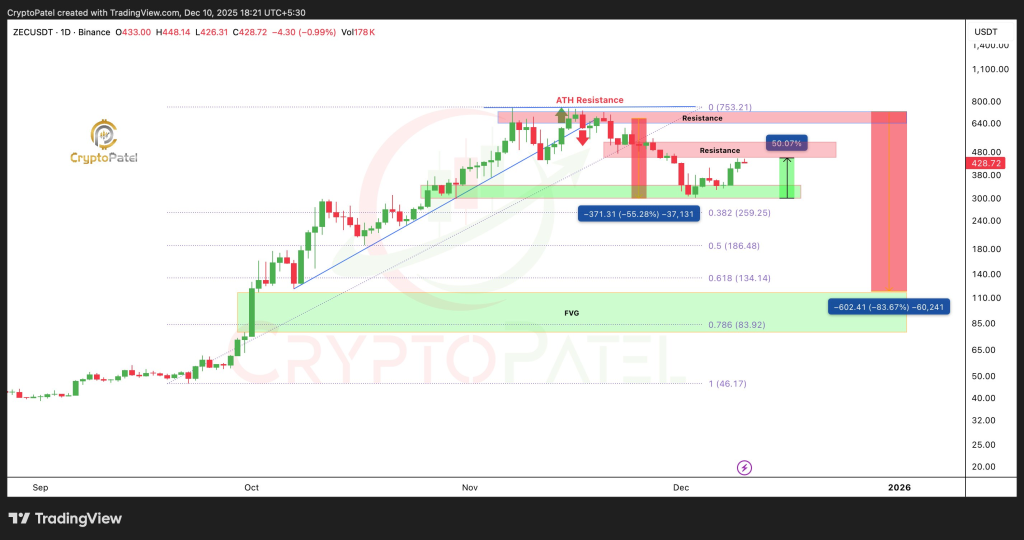
A strong move above $500 would confirm that Zcash has enough momentum to target the wider zone underneath the old high. A failure to hold above the same level would place ZEC back into the structure that previously triggered the slide toward $300. The chart makes this dynamic clear because each approach to the zone stalled and reversed without producing a breakout.
Crypto Patel’s chart outlines the lower regions that become relevant if ZEC gets rejected again. Fibonacci levels around $259, $186, and $134 appear beneath the current range. A larger green zone covering the fair value gap between $90 and $110 sits even lower on the chart. These areas represent previous reaction zones where Zcash created strong swings in the past.
ZEC price displayed a pattern of sharp moves whenever the upper structure broke down. The earlier fifty percent fall from the $700 zone toward the $300 zone followed the same type of rejection at a major resistance block. Crypto Patel referenced this history to explain why traders should prepare for both directions instead of assuming a single outcome.
What Crypto Patel Sees As The Next Major ZEC Price Move
Crypto Patel described the current ZEC range as a point where the market must choose between continuation or deeper correction. Zcash now trades around $428, and the candles remain inside a tight consolidation under the red resistance zone. This creates a setup where any breakout or rejection carries more weight than usual.
A clean break above $500 would show a shift in ZEC price strength and open the door to retest the region that previously held above $700. A stall at the same level would fit the pattern that shaped the earlier declines, which would bring the lower demand regions back into focus. His message emphasized risk management because ZEC has produced large swings in both directions this cycle.
The structure on the chart makes this moment easy to visualize. ZEC sits between a heavy resistance band and a series of deep support markers. Every candle inside this zone adds to the tension that builds before a breakout or reversal.
Subscribe to our YouTube channel for daily crypto updates, market insights, and expert analysis.