Cardano (ADA) is back on traders’ radar this week after a familiar pattern reappeared on the chart – one that’s led to explosive moves in the past. According to a new tweet from World of Charts, ADA is testing the upper boundary of a long-term descending channel and may be gearing up for a breakout that could send the price as high as $1.50.
The setup is almost identical to two previous rallies that delivered gains of over 150% and 230%, respectively. Now, the question is whether history is about to repeat itself. With ADA trading near $0.75 and pushing against resistance, all eyes are on whether the bulls can deliver the breakout – or if this is another false alarm.
What you'll learn 👉
📈 Chart Analysis: Cardano (ADA/USDT) on the 2D Timeframe
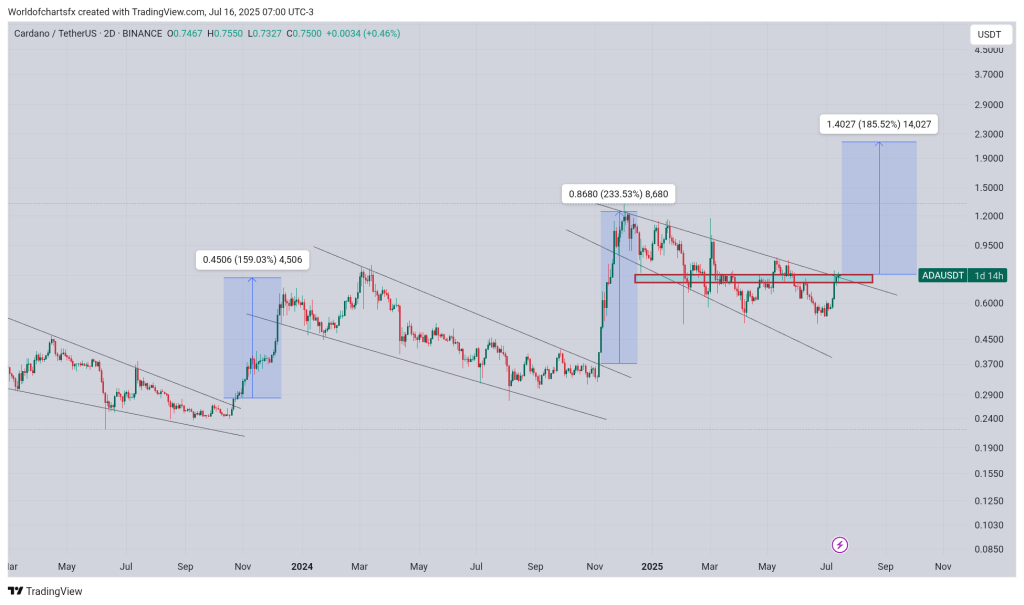
The chart posted by WorldOfChartsFX shows Cardano (ADA) breaking out of a falling wedge formation for the third time in two years. The current setup looks very similar to two previous breakouts that led to explosive gains.
🔁 First Rally – Late 2023
The first breakout occurred around October–November 2023. ADA broke out of a downtrend channel and rallied from around $0.28 to $0.73 – a 159% move. The breakout was clean, followed by strong bullish candles and increased volume. After that, price consolidated slightly before continuing higher.
🔁 Second Rally – November 2024
A similar breakout occurred again in November 2024. This time, ADA surged from around $0.37 to $1.24 – an interesting 233% increase. The pattern was again a breakout from a descending wedge, with price pushing past horizontal resistance and confirming with a retest before liftoff.
📊 Current Setup: Is History Repeating?
Now, ADA is testing the same descending trendline that capped the last 9 months of price action. The red box in the chart marks horizontal resistance around $0.62–$0.66, which ADA just broke above. The wedge is narrowing, and price has already closed outside the upper trendline. If this breakout holds, the setup is structurally similar to the last two rallies.
The measured move on this chart projects a potential 185% rally, which would take ADA to about $1.40–$1.50. That would put it just shy of its November 2024 high.
Read also: SUI vs Solana: Which Crypto Should You Bet On This Cycle?
🤔 Opinion on the $1.50 Prediction
The structure looks solid. Historically, falling wedge breakouts in ADA have delivered strong follow-through when backed by volume and confirmation. In both 2023 and 2024, the rallies didn’t stop after initial resistance – they extended over weeks, with few deep pullbacks.
If current market conditions remain bullish and BTC doesn’t reverse sharply, this breakout has room to run. A clean retest of the red box ($0.62–$0.66) would further strengthen the case. However, ADA must hold above the wedge to avoid a fakeout. If it falls back inside the pattern, bulls could lose momentum.
The $1.50 target is far from guaranteed, but based on past price behavior and this clean technical setup, it’s within reach – especially if sentiment stays strong.
Subscribe to our YouTube channel for daily crypto updates, market insights, and expert analysis.