
Cardano (ADA) price has been building strength in May, showing signs of a potential breakout as we head into June. The price is trading at $0.7565, up 4.13% over the past day, while trading volume has increased by 10% — a sign of renewed interest. So, is ADA finally preparing for that push toward $0.80 and beyond?
We took a look at the ADA/USDT chart.
What you'll learn 👉
Cardano Chart Structure Suggests Breakout Potential
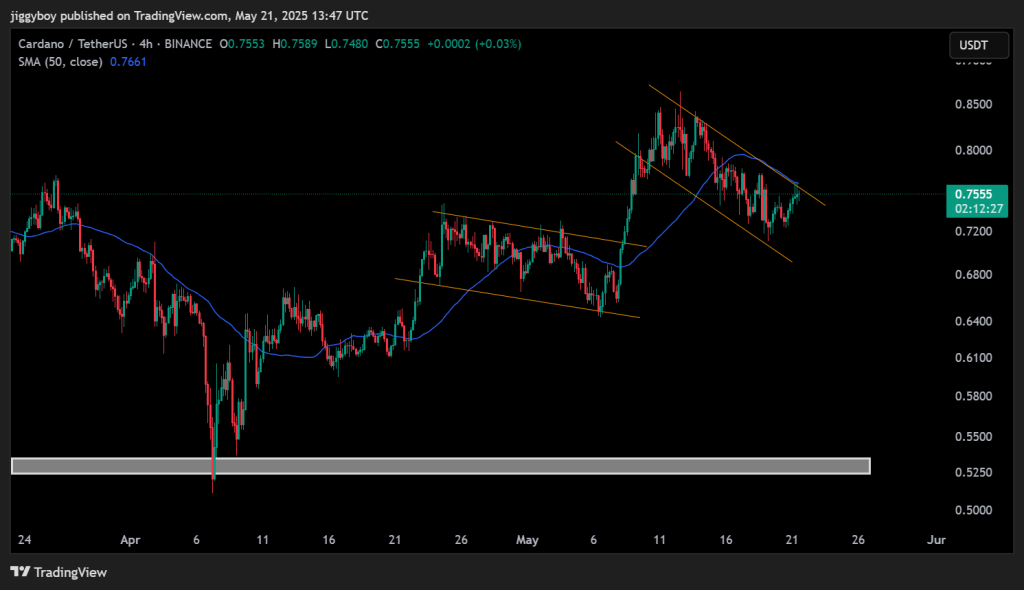
Technically, ADA price is moving in a well-defined bullish continuation pattern. On the 4-hour chart, price action has followed a repeating structure of falling channels, or bull flags, that consistently resolved to the upside. ADA is now trading within its third descending channel since April, once again testing the upper boundary.
The 50-period Simple Moving Average (SMA) sits at $0.7661, acting as dynamic resistance. A clean break above the trendline and this SMA would likely confirm the start of a new upward leg. The support zone between $0.7200 and $0.7350 remains intact, which is key to maintaining the bullish structure.
Volume remains steady, and the breakout attempts show strong intent. The repeating pattern of flag → breakout → flag → breakout indicates bulls are still in control, even with pullbacks.
Technical Indicators Are Mixed, But Tilt Bullish
The latest technical readings show a market trying to regain bullish momentum. Here’s what the indicators say:
| Indicator | Value | Signal |
| ADX (14) | 28.681 | Moderate trend, Sell |
| CCI (14) | 4.7906 | Neutral |
| Ultimate Oscillator | 43.165 | Weak momentum, Sell |
| ROC (Rate of Change) | 1.136 | Bullish momentum, Buy |
While ADX confirms that a trend is forming, it still shows bearish pressure dominating. CCI sits near zero, indicating a lack of clear momentum either way. Ultimate Oscillator leans bearish for now. However, the ROC shows bullish momentum building, a promising early sign.
Read Also: How High Can Bitcoin Price Go After Breaking Above Its ATH?
ADA Price Prediction for June
If ADA can break and hold above the $0.7700 level, there’s a good chance it pushes toward $0.80–$0.85 in the short term. Beyond that, a retest of the $0.8646 swing high is possible if volume picks up and BTC remains stable.
On the downside, losing the $0.7200 support could lead to a move back toward $0.69–$0.70. This would invalidate the current flag pattern and delay any breakout.
For now, market structure leans bullish, but momentum needs to follow through. A clean 4H candle close above resistance, ideally with volume, would confirm the breakout and open the door for higher levels in June.
Falling Wedge Could Be the Wild Card For ADA Price
Another setup worth watching is the falling wedge pattern spotted on ADA’s chart from May 7 to May 20. Price dropped from $0.8646 into the wedge and is now testing its upper resistance line. This formation often appears just before a trend reversal or explosive breakout.
looks like $ada is setting up for the move back above $1, ready? pic.twitter.com/KK0PjQL1Us
— jupiter ⭕ (@stockjupiterr) May 20, 2025
Support has held around $0.698–$0.700, and resistance is visible near $0.7536. If the wedge breaks to the upside, ADA price could retest $0.80, and possibly head toward the $0.90–$1.00 range in June.
A recent tweet by Jupiter hints at that same setup:
“Looks like $ADA is setting up for the move back above $1, ready?”
With strong technical patterns and price compressing toward key breakout points, ADA’s June outlook looks promising, if buyers can follow through.
Subscribe to our YouTube channel for daily crypto updates, market insights, and expert analysis.

We recommend eToro
Wide range of assets: cryptocurrencies alongside other investment products such as stocks and ETFs.
Copy trading: allows users to copy the trades of leading traders, for free.
User-friendly: eToro’s web-based platform and mobile app are user-friendly and easy to navigate.