AAVE is hovering close to its monthly high, and the charts are still looking bullish across multiple timeframes. Based on a fresh technical update, the Bulls are doing a solid job defending key support zones.
At writing, AAVE price is trading around $286, and it’s sitting just below a potential breakout level that could open the door to more upside if there’s enough volume behind the move.
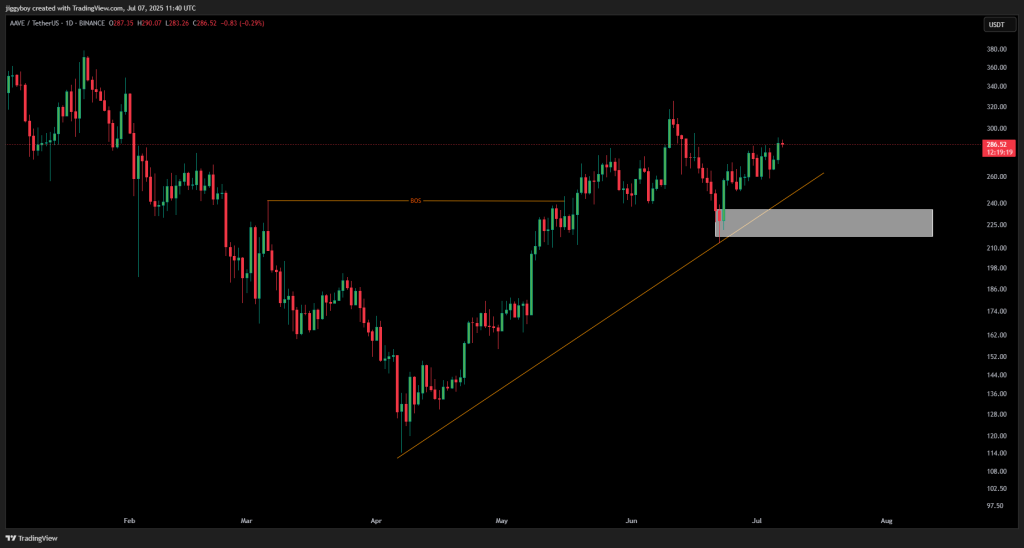
Looking at the charts, both the daily and 4H setups show a clear uptrend that’s been in place since mid-April. AAVE has been climbing steadily inside an ascending channel, forming consistent higher highs and higher lows. That structure kicked off after a break of structure (BOS) back in early May, and momentum hasn’t slowed much since.
On the daily chart, AAVE price is slowly approaching a key resistance area near $310, the same level it hit back in mid-June. The big zone to watch on the downside is between $220 and $240. That range was tested not long ago and held up well, confirming strong demand at those levels.
There’s also a steep trendline on the chart that’s been acting as dynamic support, stretching from April’s low all the way through the recent price action. If bulls manage to push AAVE price above $300 and do it with strong volume, there’s a real chance the next leg up could target the $340 range.
Short-Term Momentum Confirmed on AAVE Chart
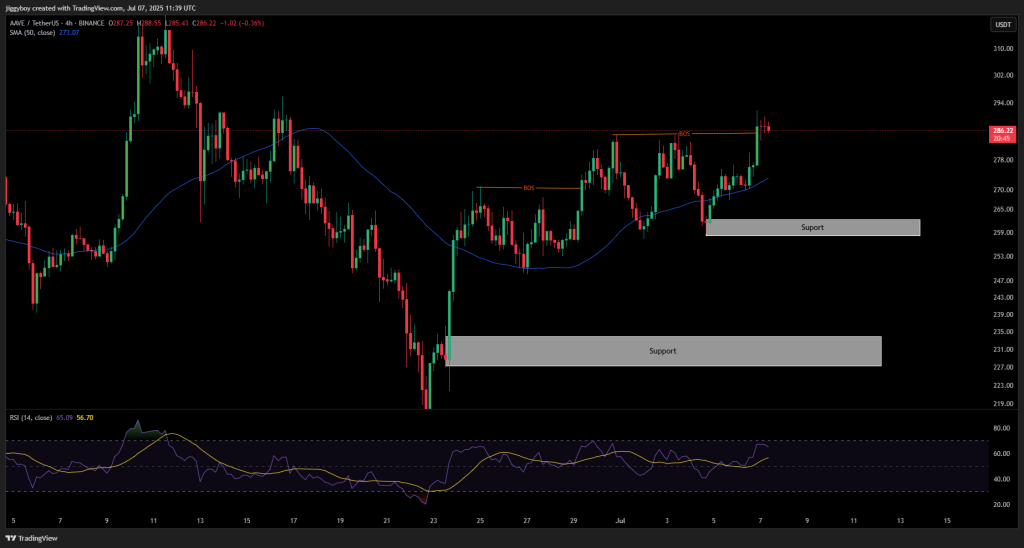
The 4H chart further supports the bullish outlook. A second BOS near the $285 mark confirms near-term strength. AAVE price is also higher than the 50-period SMA, which is moving towards $273. This increasing average aligns with a nearby support cluster around the $259-$265 zone, where already price has bounced back.
The 4H RSI is around 65 and still has the buyers in control without the asset being overbought. If the bulls continue to stay in the zone and recover the $300 handle, the local peak of $310 could come under pressure later on.
AAVE Price Key Support and Resistance Levels to Monitor
Immediate support remains at $259–$265 on the 4H chart and $220–$240 on the daily chart. Resistance is found at $300, followed by the $310 swing high. The 4H RSI at a daily close above $300 will be a decent technical sign of trend continuation for the price of AAVE.
Technical indicators in both timeframes are aligned with the ongoing bullish trend. However, confirmation with volume will be needed to validate any breakout above resistance.
Subscribe to our YouTube channel for daily crypto updates, market insights, and expert analysis.