AAVE Price Could Spike +100% Following Breakout From This Key Resistance: Here’s the Outlook
World of Charts posted an analysis of AAVE chart showing a symmetrical triangle, formed by converging trendlines—one descending and the other ascending. This indicates that the price has been squeezing into a narrower range, with neither bulls nor bears fully in control.
The price is nearing the upper boundary of the triangle, signaling a potential breakout. Based on the analysis, a successful breakout above this resistance could lead to a strong bullish wave.
Based on the post, the chart projects a potential target of around $200, which is a 120% gain from the breakout point. This target is calculated by measuring the height of the triangle’s widest part and projecting it from the breakout point.
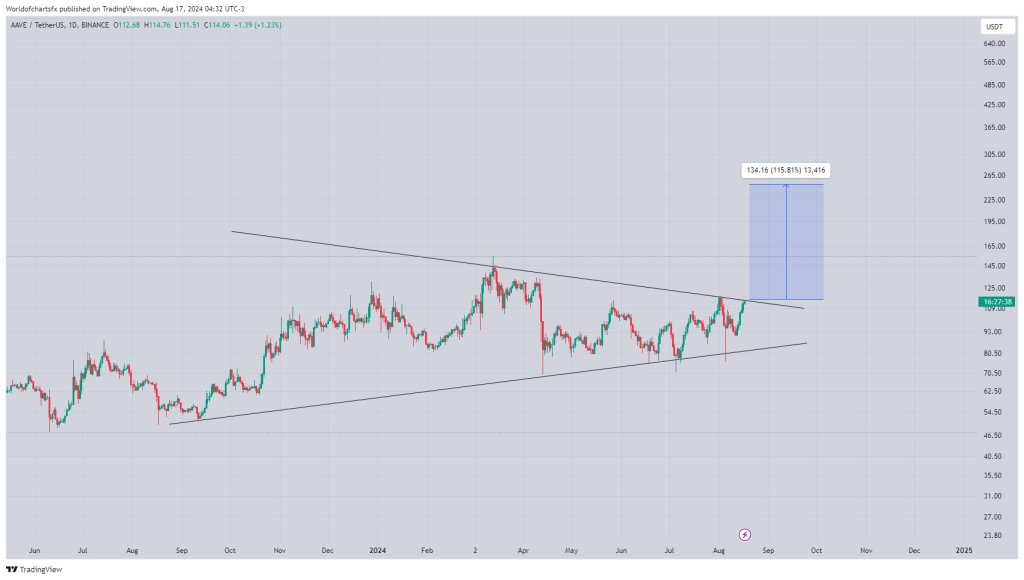
The chart shows Aave’s price attempting to break out of the triangle, with increasing momentum. A confirmed breakout above the upper trendline would likely initiate a strong upward move, as indicated by the bullish target area.
In conclusion, the chart and analysis imply that Aave is at a critical juncture. If it successfully breaks out of the symmetrical triangle, there is a high probability of a sustained bullish rally towards the $200 level in the near future.
Doge2014 raises 500K in days celebrating Dogecoin. Make potentially big profits and get in on exclusive airdrop!
Show more +What you'll learn 👉
Bullish Scenario:
If Aave breaks above the upper trendline of the symmetrical triangle with strong volume, it would signal a potential bullish continuation. The target for this breakout, as mentioned, is around $200, which represents over a 120% increase from the breakout point.
A spike in trading volume accompanying the breakout would add validity to the move. In this case, the price could see a steady rise toward the target, with minor pullbacks along the way as traders take profits.
Bearish Scenario:
A common scenario in trading patterns like these is the possibility of a false breakout, where the price briefly moves above the trendline but fails to hold and then falls back into the pattern. This can trap bullish traders, leading to a sharp decline as stop-loss orders are triggered.
Read Also: Polygon’s Upgrade From MATIC to POL Marks ‘A New Era’ – Here’s Why
If the price fails to sustain above the resistance and reverses, it might retest the lower trendline of the triangle. A break below this lower trendline would invalidate the bullish pattern and could lead to a significant decline.
Neutral Scenario:
There’s also a chance that Aave continues to consolidate within the triangle, with neither bulls nor bears taking decisive control. This could result in more sideways action until a breakout or breakdown finally occurs
Subscribe to our YouTube channel for daily crypto updates, market insights, and expert analysis.

We recommend eToro
Wide range of assets: cryptocurrencies alongside other investment products such as stocks and ETFs.
Copy trading: allows users to copy the trades of leading traders, for free.
User-friendly: eToro’s web-based platform and mobile app are user-friendly and easy to navigate.