Over the last 24 hours, AAVE token has seen conflicting signals. On one hand, a popular technical indicator has just flashed a fresh “buy” signal. On the other, the daily price chart is flashing signs of weakness that traders shouldn’t ignore. This leaves the AAVE price at a critical crossroads, where both bulls and bears are watching closely.
According to a post shared by well-known analyst Ali (@ali_charts), a bullish signal has just appeared on the 1-hour AAVE chart. The chart, which uses the TD Sequential indicator, shows a completed 9-count followed by a bullish “1” candle. This pattern often signals the start of a price reversal, especially after a prolonged downtrend.
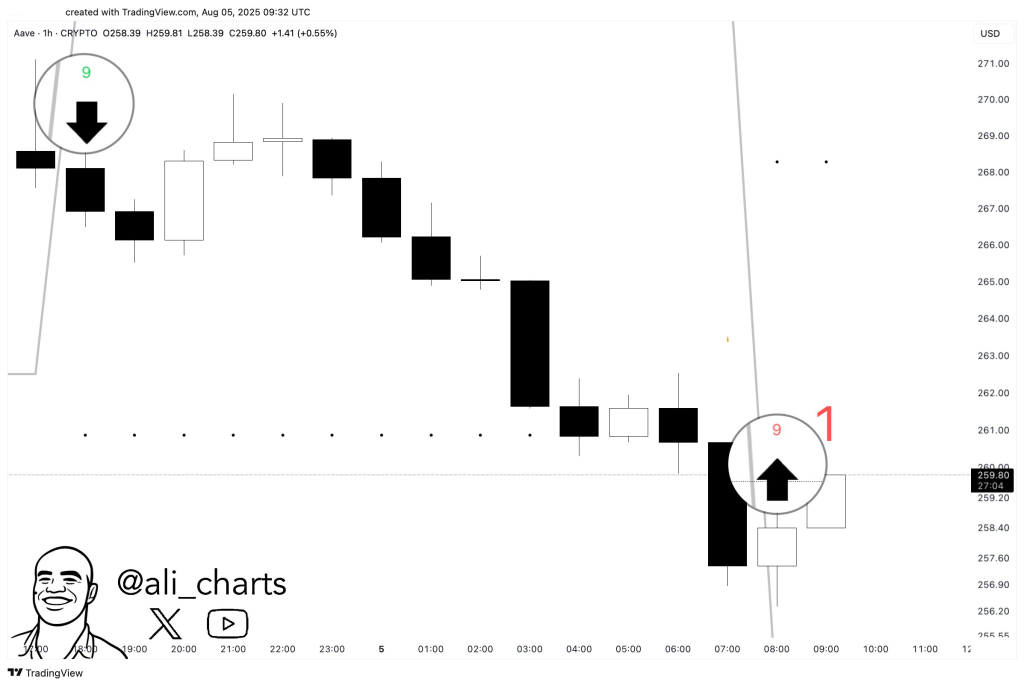
Ali pointed out the shift with a simple but powerful visual. Earlier on, the same indicator flashed a “9” sell signal right before AAVE began to fall. Now, after hours of red candles and a gradual decline, a new “9” signal in the opposite direction has emerged. This is typically interpreted as a call for cautious optimism. The TD Sequential has a history of marking local tops and bottoms, so this new signal could mean that a bounce is forming around the $259 level.
But indicators alone are never the full picture.
AAVE Price Retests Broken Trendline and Faces Rejection
While the TD Sequential suggests a possible bounce, the daily chart of the AAVE token is showing a much less hopeful story.
Over the last few months, AAVE has followed a steady upward trend, bouncing off a rising trendline multiple times. This line has acted as a key area of support since early April. However, just a few days ago, the AAVE price broke below that trendline. Instead of recovering quickly, the token has now returned to retest that same line from below — and it is being rejected.
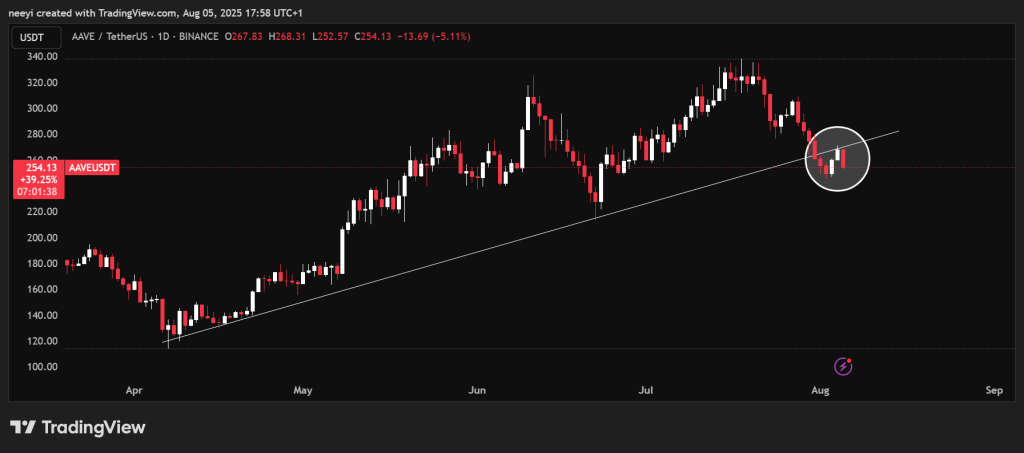
This is often a classic bearish sign. When a support line breaks and then turns into resistance, it usually signals that sellers are still in control. The recent price action confirms this. After touching the trendline, AAVE reversed sharply and is already down more than 5% today alone. This kind of move suggests that the upward momentum is fading and that the token might continue drifting lower if buyers cannot reclaim the broken support.
AAVE Token Stuck Between Signal and Structure
The AAVE price is now caught in a tug-of-war between a hopeful indicator and a concerning technical setup.
On the short-term chart, the TD Sequential is clearly suggesting that a reversal is possible, and this has given traders like Ali reason to watch closely for a bounce. But when you zoom out, the picture changes. The AAVE token has broken a key structure and is now rejecting the very line that held it up for months.
This means that unless bulls step in quickly and push the price back above that rising trendline, the recent buy signal may not hold.
Read Also: This PI Network Secret Integration With Google Could Make PI Coin the Next Big Thing
Right now, AAVE is trading around $254. For it to regain strength, it would need to break back above the $265–$270 zone and stay there with strong volume. Otherwise, the trendline rejection could lead to more downside in the coming days.
Subscribe to our YouTube channel for daily crypto updates, market insights, and expert analysis.