Kaspa Is Close to This Trader’s ‘Buy Zone’, but How Low Could KAS Go if Bitcoin Falls to $50K?

In February, Kaspa touched $0.025 and bounced almost at once. In August, it spent days near the same price before buyers got anywhere. Both visits help explain why trader Renksi wants to buy KAS around two and a half cents again. They also tell two different stories about what buying at that price can feel like.
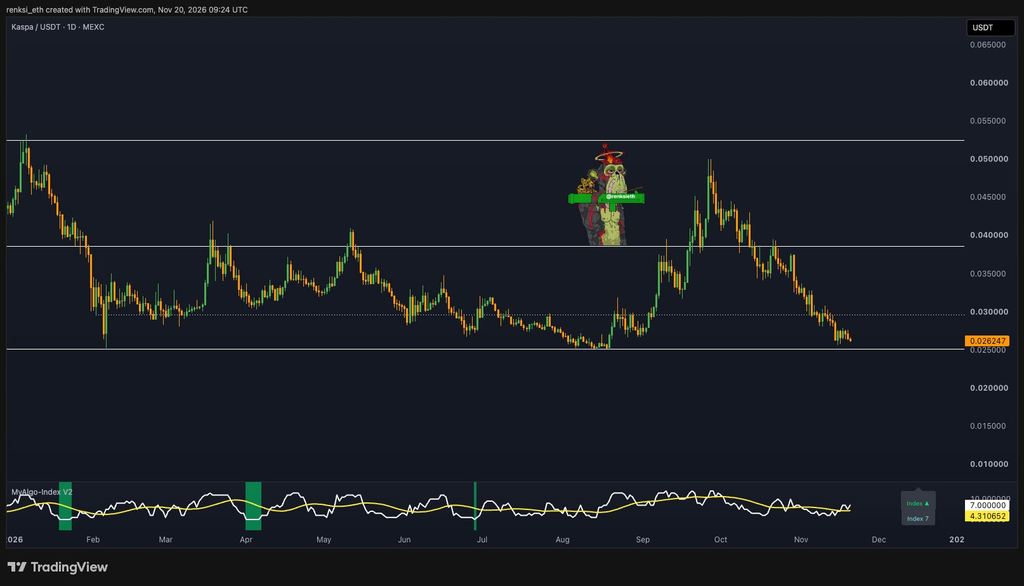
Renksi’s November 20 chart had KAS at $0.026247 on MEXC, roughly 4.8% above a move down to his entry when measured from the chart price. He wrote that Bitcoin had fallen to around $61,000 that day. He still liked the Kaspa entry, but planned to keep some cash available in case Bitcoin headed toward $50,000 and took KAS lower with it.
What Happened the Last Two Times Kaspa Hit $0.025?
February’s test is easy to miss on the daily chart. A long wick reached the lower white line near $0.025, then the candle closed well above its low. Anyone waiting for an exact fill had a short opportunity. KAS spent much of the following month around $0.03 before briefly trading above $0.04 in March.
August gave buyers plenty of time. Several daily candles gathered along $0.025, with little to show for buying the first touch. The eventual rally was the bigger one, though. By late September, KAS was trading near $0.05. Someone who bought near the August floor had a chance to nearly double their money. By November 20, someone who held through the entire move had a gain of only about 5%.
That round trip is the part of Renksi’s chart I’d pay closest attention to. He has a good historical reason to pick an entry near $0.025. The same history says considerably less about how long a rebound might last.
Read also: Over 27% of Kaspa Supply Has Not Moved in Two Years Despite KAS Price Collapse
What Would Make the Next KAS Price Bounce Convincing?
On the way down from September’s high, KAS lost the middle white line near $0.0385. It then slipped below $0.03, an area where it had spent weeks trading earlier in the year. The latest candles are still making lower highs as they approach Renksi’s buy zone.
For me, $0.03 is the more revealing test on the way back up. A move from $0.025 to $0.03 would already pay an early buyer 20%. A rally that stalls there could be a decent trade and still leave the November downtrend intact. A few daily closes back above three cents would give buyers a better case for another run at $0.0385.
Renksi leaves his next entry open if $0.025 gives way. He gives a downside scenario for Bitcoin but no corresponding KAS target. That restraint makes sense here. His chart records exactly where Kaspa buyers showed up twice. If KAS starts closing below that line and struggles to get back above it, the chart has much less to say about where they’ll show up a third time.
For more crypto news and price predictions, click here.
Subscribe to our YouTube channel for daily crypto updates, market insights, and expert analysis.