
XRP price is around $1.00 now, but CasiTrades believes the next few cents could have consequences that last far longer than a normal support test.
Her latest chart puts XRP between two very different outcomes.
A double bottom around $1 could allow the current bullish wave structure to survive and keep a larger move higher on schedule.
A deeper drop toward $0.90, however, would force the analyst to reset her shorter-term wave count and potentially push the next major XRP rally back by several months.
That makes the difference between $1 and $0.90 much more important than the 10-cent gap suggests.
What you'll learn 👉
XRP Has Already Lost Several Important Fib Levels
CasiTrades’ one-hour chart shows XRP trading below both the local 0.854 Fibonacci retracement at roughly $1.086 and the larger 0.786 level near $1.091.
That area had previously acted as an important support cluster.
Once price lost it, the next major level became much clearer.
The chart marks the 1.0 Fibonacci level near $0.9855, essentially placing the psychological $1 mark at the center of the next possible reversal area.
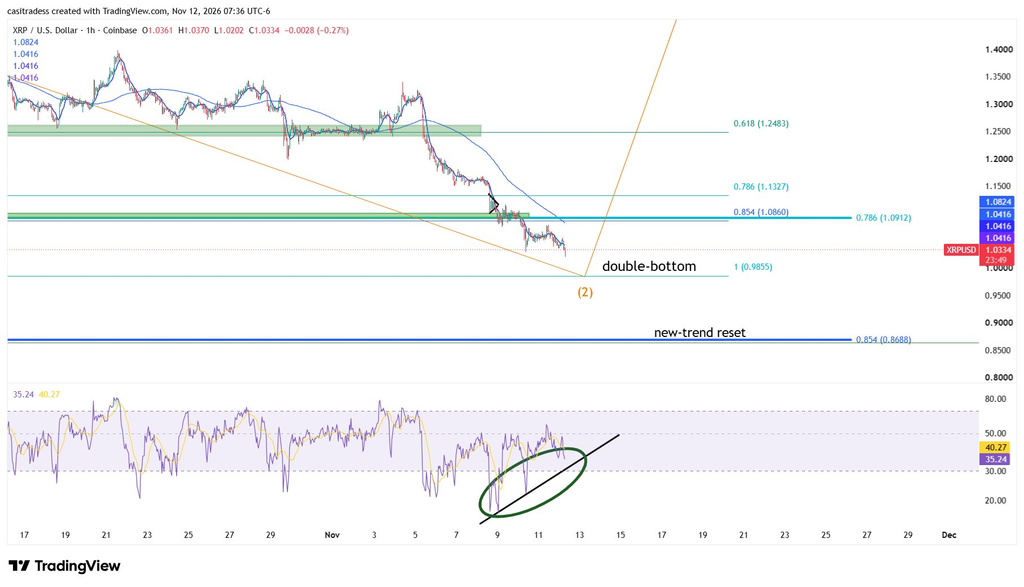
CasiTrades believes a double bottom around that level could complete the current subwave 2.
If that happens, the larger bullish count would remain intact without requiring a full structural reset.
Why $0.90 Would Change the XRP Timeline
The second scenario is more complicated.
CasiTrades marks another major macro support near $0.8688, broadly matching the $0.87-$0.90 region she has discussed previously.
If XRP falls into that area and prints a new low, she would no longer treat the current move as a simple completion of the existing subwave.
Instead, the wave structure would need to rebuild.
In Elliott Wave terms, that could mean forming another smaller Wave 1 and Wave 2 before the larger impulsive phase begins.
That is why she warns that a drop toward $0.90 could delay the next major move by months.
Importantly, she does not see $0.90 as invalidating her long-term bullish XRP thesis.
Her macro targets remain valid unless XRP falls below the October 2025 low around $0.77.
Read also: Crypto Market Crash: How Low Can Bitcoin and XRP Go?
Bullish RSI Divergence Is Starting to Appear
There is one encouraging signal on the chart.
Price has continued making lower lows, but RSI is beginning to form higher lows.
That is a classic bullish divergence.
It means XRP price is still falling, but the strength behind the selling is not falling with it.
The RSI reading on the chart sits around 35, compared with deeper lows earlier in the decline.
CasiTrades is watching the rising RSI trendline closely because holding it would strengthen the argument that sellers are beginning to lose momentum.
That does not guarantee $1 will become the bottom.
Bullish divergence can persist for some time before price finally reverses.
But it makes the current support test more interesting than a simple continuation lower.
Read also: AI Predicts XRP Price for the End of 2026
What XRP Bulls Need to See
The first task is obvious: XRP needs to defend roughly $0.98-$1.
A reaction there followed by a recovery toward $1.09 would return price to the Fibonacci zone it recently lost.
Above that, approximately $1.13 becomes another meaningful level before the larger $1.25 region comes back into view.
The downside path is equally clear.
Losing $1 keeps $0.90 in play.
Reaching $0.90 would not destroy CasiTrades’ long-term expectation for double-digit XRP prices, but it could dramatically change how quickly that scenario develops.
That is what makes the current setup unusual.
For more crypto news and price predictions, click here.
Subscribe to our YouTube channel for daily crypto updates, market insights, and expert analysis.