XRP price is back near the $1 mark after another bruising stretch for the crypto market, and analyst Crypto Patel believes the area could become one of the most important accumulation zones of the current cycle.
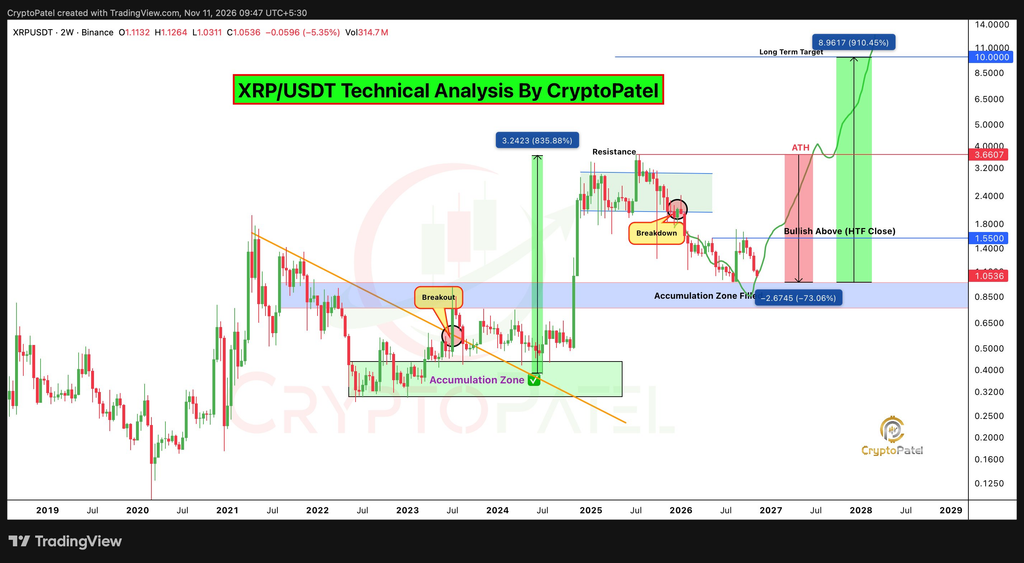
His long-term chart places XRP inside a broad $1.00-$0.70 accumulation region.
But the setup comes with a clear warning.
If XRP confirms a breakdown below $1, Patel believes another 30% to 40% correction could follow before the larger bullish structure has a chance to develop.
What you'll learn 👉
Why the $1-$0.70 XRP Zone Matters
Patel’s two-week chart shows the XRP price falling back into an area that acted as a major base before previous expansions.
The upper end of the zone sits near $1, while the lower boundary stretches toward roughly $0.70.
That gives the setup an unusual risk/reward profile.
At around $1.05, XRP is already close to the upper edge of Patel’s accumulation range. A drop to $0.70 would mean another decline of roughly 33%.
That lines up almost exactly with the 30%-40% downside risk he outlined.
The important point is that Patel is not calling $1 an automatic bottom.
He is treating it as the beginning of a region where long-term buyers may start paying attention.
A Break Below $1 Would Change the Short-Term Picture
Patel’s chart marks $1 as the key psychological and technical line.
If XRP can stabilize around this area and recover, the long-term structure remains alive.
If the token instead produces a confirmed higher-timeframe close below $1, the chart opens toward the lower part of the accumulation box.
That would put approximately $0.85-$0.70 into focus.
The broader market environment makes that risk hard to dismiss.
XRP has been hit by weak risk appetite and large exchange inflows. One recent report showed roughly 691 million XRP, worth close to $900 million at the time, moving onto Binance during the latest selloff.
Transfers to exchanges do not prove those coins were sold, but they increase immediately available supply and can reinforce bearish sentiment during a fragile market.
$1.55 Is the First Major Level Bulls Need Back
Patel’s chart also gives a useful upside trigger.
The major level is around $1.55.
He labels a higher-timeframe close above that area as bullish.
That makes $1.55 much more important than a small relief bounce from $1.00.
A move from current levels to $1.55 would already require roughly a 48% recovery.
Only after that would the chart begin opening toward the previous high around $3.66.
Patel’s long-term projection then extends toward $10.
Read also: Ripple CTO’s 2.5M XRP Sale Creates Fresh Debate Over Insider Holdings
How Realistic Is the $10 XRP Target?
From roughly $1.05, reaching $10 would mean an increase of more than 850%.
That is why the $10 level should be treated as a full-cycle target rather than a near-term prediction.
Patel’s own chart makes that distinction clear.
The projected path does not show XRP going straight from $1 to $10. It first requires stabilization, a recovery above $1.55, a return toward the previous all-time-high region, and only then a larger continuation.
The chart’s real message is therefore less about $10 and more about positioning.
Patel believes the best long-term risk/reward may appear when XRP looks the least attractive to short-term traders.
But there is a big difference between accumulating inside a support zone and assuming the bottom is already in.
If $1 fails, XRP could still have one painful leg toward $0.70 before the long-term bullish case gets its next real test.
For more crypto news and price predictions, click here.
Subscribe to our YouTube channel for daily crypto updates, market insights, and expert analysis.