
Gold may still have significantly more downside ahead if a new 2027 gold price forecast shared by analyst DanielxHarald plays out.
The analyst compared the current decline with gold’s 2008 correction and mapped a possible move toward roughly $3,333 by mid-2027. His thesis combines Fibonacci retracement levels, an ABC corrective structure and the point of control from a previous consolidation range.
Gold was trading near $4,165 on the weekly chart when the analysis was posted, leaving the projected $3,333 target around 20% below current levels.
Why the Analyst Is Watching $3,333
DanielxHarald starts with the 2008 correction, when gold fell roughly 34% over 217 days.
Applying the same 34% decline to the latest all-time high would place gold near $3,700. However, he argues that the chart does not show meaningful structural support in that region.
His weekly chart instead focuses on three lower reference points.
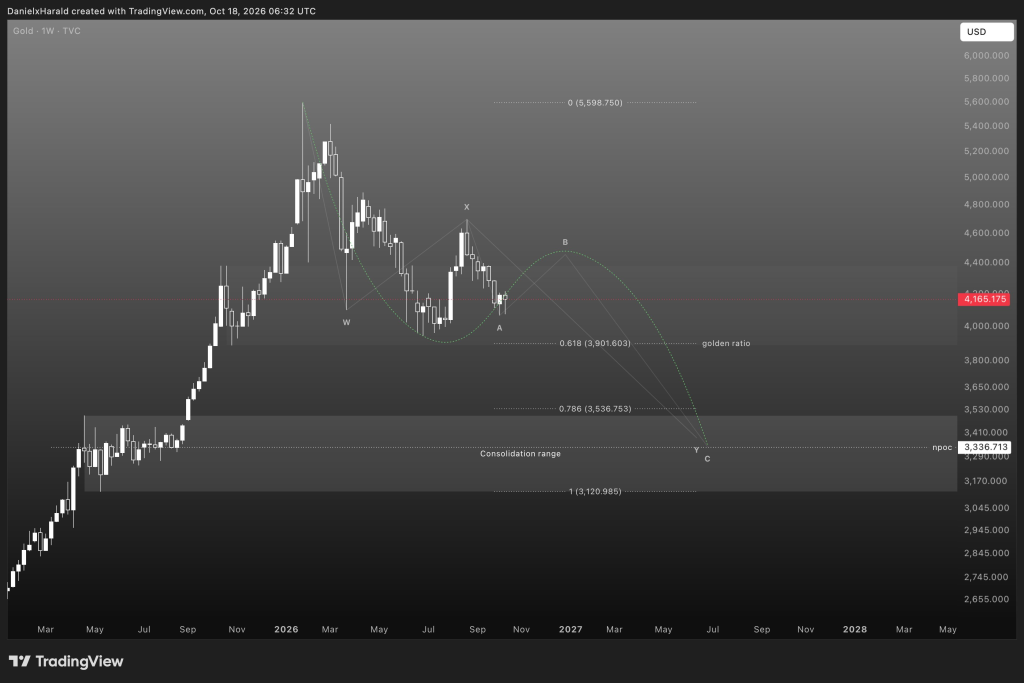
The 61.8% Fibonacci retracement appears around $3,901.60, the 78.6% level near $3,536.75, and the previous range’s point of control sits close to $3,336.71.
That last zone is particularly important to his forecast.
From the marked all-time high around $5,598.75 to $3,333, gold would lose approximately 40.5%. From the current price near $4,165, reaching that area would mean another decline of about 20%.
Read also: Gold and Silver Price Predictions for This Week (October 19-25)
The ABC Structure Behind the Gold Forecast
The chart also maps a possible larger W-X-Y correction.
Gold first declined into the area marked W, then rebounded toward the X wave before dropping again. The analyst is now considering whether the current structure could develop into a Y wave containing its own A-B-C sequence.
In that framework, gold may first complete wave A near current levels, then rebound during wave B.
The green projected path places that B-wave recovery around the $4,400-$4,500 region before another decline develops.
If wave B retraces roughly 61.8% of wave A, the analyst calculates that wave C reaching approximately $3,333 would be close to twice the length of wave A. That combination of Fibonacci geometry and the old range’s point of control is why the target stands out on his chart.
The timing is also part of the thesis. He notes that gold is already around 260 days into the correction, compared with 217 days during the 2008 decline. His symmetry projection places the potential final low around mid-2027.
This remains a technical scenario, not a confirmed path. A stronger recovery above the projected B-wave area, particularly if gold begins reclaiming previous weekly highs, would weaken the structure behind the $3,333 call.
For now, however, the chart lays out a clear sequence: a possible rebound first, followed by another larger decline toward the old consolidation zone if the broader correction continues.
For more financial news and price predictions, click here.
Subscribe to our YouTube channel for daily crypto updates, market insights, and expert analysis.