
Gold price enters October 16 near $4,150 after an unusually volatile 48 hours.
The metal initially fell toward $4,100 after hotter U.S. CPI data pushed Treasury yields higher and forced markets to reconsider the Federal Reserve’s next move. Gold then recovered toward $4,160 as yields eased and the dollar lost some momentum, but buyers have not yet produced a convincing move above the recent resistance area.
I analyzed the Gold Spot/U.S. Dollar four-hour chart from October 15, with price near $4,149.9.
The chart shows gold consolidating after its latest selloff rather than immediately extending lower.
The $4,080-$4,120 region has attracted buyers several times, making it the most important near-term support zone. On the upside, price has repeatedly struggled around $4,180-$4,220.
RSI is near 50, with its average around 46.3. That puts momentum close to neutral and is a clear improvement from the weaker readings seen during the latest decline.
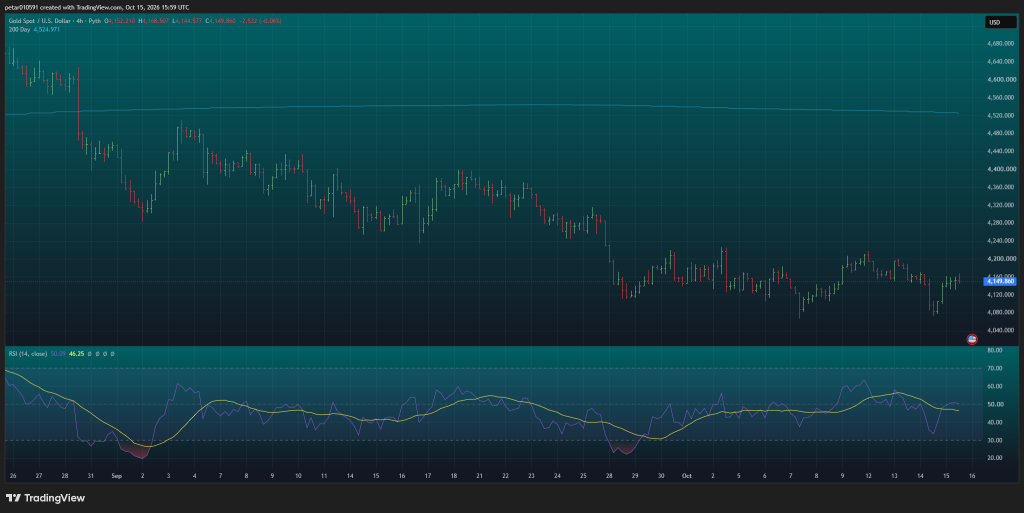
However, the broader four-hour structure remains below previous September highs, so a recovery still needs confirmation.
Gold Price Prediction for October 16
| Scenario | Confirmation | Potential move |
|---|---|---|
| Bullish | Holds $4,140 and clears $4,180 | $4,200-$4,220 |
| Neutral | Remains between $4,120 and $4,180 | Sideways consolidation |
| Bearish | Breaks below $4,120 | $4,080, then $4,050 |
Gold is currently only about 1.7% below $4,220, so a continuation of the rebound would not need a large move.
On the other hand, another break below $4,120 would put the recent low near $4,080 back in focus.
For October 16, $4,180 looks like the first level bulls need to reclaim. Until that happens, gold remains in a recovery attempt rather than a confirmed short-term reversal.
For more financial news and price predictions, click here.
Subscribe to our YouTube channel for daily crypto updates, market insights, and expert analysis.