
Bitcoin’s latest decline has brought support levels back into focus after inflation concerns and leveraged liquidations added pressure to the market. Ethereum has also lost an important price floor, which leaves both assets vulnerable if buyers cannot regain control.
The immediate question is whether this crypto market crash produces another leg lower or gives way to consolidation. The analysis below outlines possible downside levels, although those targets depend on support breaks that still need confirmation.
What you'll learn 👉
CPI Concerns And Liquidations Add Pressure To Bitcoin Price
Abdul Hadee Isah Ibraheem, who posts as @Abdulhadi021, linked Bitcoin’s decline to hotter than expected US CPI data and crowded bullish positions. His post described a fall of more than $1,500 within minutes as BTC reached $82,301.
The economic connection is straightforward. Higher inflation can reduce expectations for interest rate cuts, which can weaken demand for riskier assets such as cryptocurrencies. However, inflation concerns were only part of the explanation presented.
🚨 WHY IS BITCOIN DUMPING? HERE IS WHAT YOU NEED TO KNOW! 🚨 Bitcoin just flushed down to $82,301, dumping over $1,500 in minutes! Here is the breakdown: 1. Hot CPI Data (Macro Shock) Higher-than-expected US CPI inflation numbers hit the wire! This fuels fear that interest rates will stay higher for longer, causing investors to dump risk assets like stocks and crypto. 2. Over-Leveraged Long Liquidation Traders were heavily long near $83,800–$84,000. The macro surprise triggered stop-losses, setting off a domino liquidation cascade that drove prices straight down. Can BTC Recover? ➡️ Key Support Zone: $81,300 – $81,500 (Institutional ETF Cost Basis). As long as this level holds, a technical relief bounce remains highly probable. ➡️ Recovery Target: BTC must reclaim $83,260 to fill the imbalance and target a retest of $84,000+.
— Abdul-Hadee Isah Ibraheem (@Abdulhadi021) October 14, 2026
Ibraheem also identified a concentration of leveraged long positions near $83,800 to $84,000. A price decline through that area can activate stop losses and force exchanges to close positions that no longer meet margin requirements.
Those liquidations can deepen an initial decline because positions are closed automatically. The resulting selling does not necessarily mean every participant has voluntarily abandoned a bullish outlook.
Ducky, who posts as @0xDucky1st, described a similar pattern. The account reported more than $450 million in Bitcoin liquidations over 24 hours, with nearly 90% attributed to long positions. Those figures are claims from the supplied commentary, rather than independently confirmed totals.
Bitcoin Price Could Fall Toward $77,000 If Support Breaks
Bitcoin price has declined for 2 consecutive days and is now close to support around $80,400 in the supplied analysis. This area matters because a sustained break would weaken the case for an immediate recovery.
The first downside scenario places BTC near $77,000 today. That outcome would require sellers to push through support and prevent buyers from quickly recovering the lost level.
A deeper decline toward $74,000 becomes a possibility before the end of the week if market conditions deteriorate further. This remains an extended bearish scenario, not an inevitable destination following a brief move below $80,400.
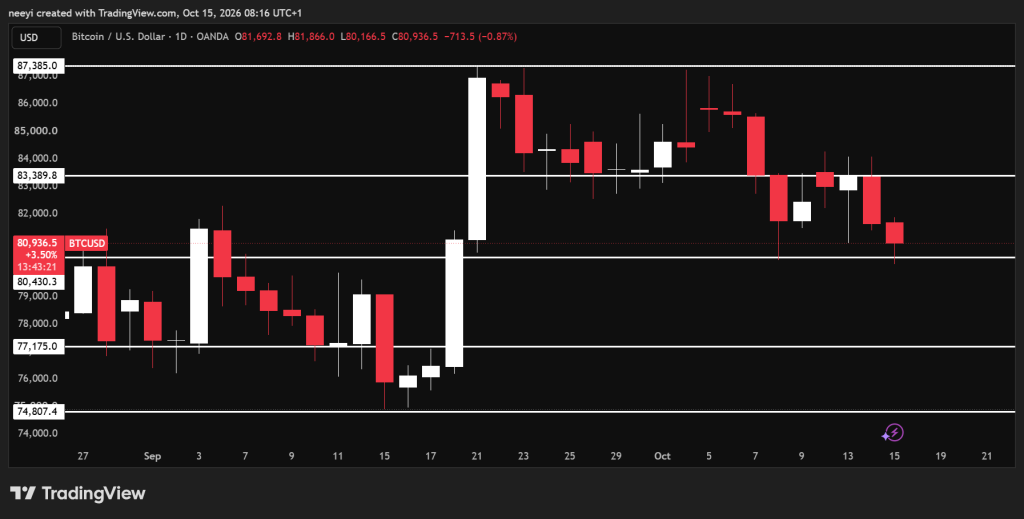
Several nearby levels appear across the supplied commentary. Ibraheem identified $81,300 to $81,500 as support and described that zone as an institutional ETF cost basis. Ducky focused on whether approximately $80,300 to $81,000 could hold.
These references place attention on a broad support area around $80,000 to $81,500. They do not establish that institutional buyers will defend a particular price, especially without the underlying cost basis methodology.
The immediate Bitcoin price scenarios are:
- Bearish Scenario: A sustained loss of the $80,000 to $80,400 area could expose $77,000, followed by $74,000 under heavier selling.
- Consolidation Scenario: Bitcoin could trade between approximately $80,000 and $83,000 if neither side establishes control.
- Recovery Scenario: A sustained break above $83,400 could open a possible route toward $87,400.
The recovery case also has intermediate hurdles. Ibraheem identified $83,260 as an initial reclaim level before a possible retest of $84,000 or higher.
That makes the area around $83,260 to $83,400 important for judging recovery strength. A brief bounce below resistance would leave the broader downside risk unresolved.
Ethereum Price Risks $2,220 After Losing Key Support
Ethereum price has broken below support around $2,360 in the supplied analysis. The immediate concern is whether that former floor becomes resistance during the next recovery attempt.
A failure to regain the area could leave ETH vulnerable to $2,220 before the end of the day. This scenario depends on continued selling after the breakdown, rather than the support loss alone.
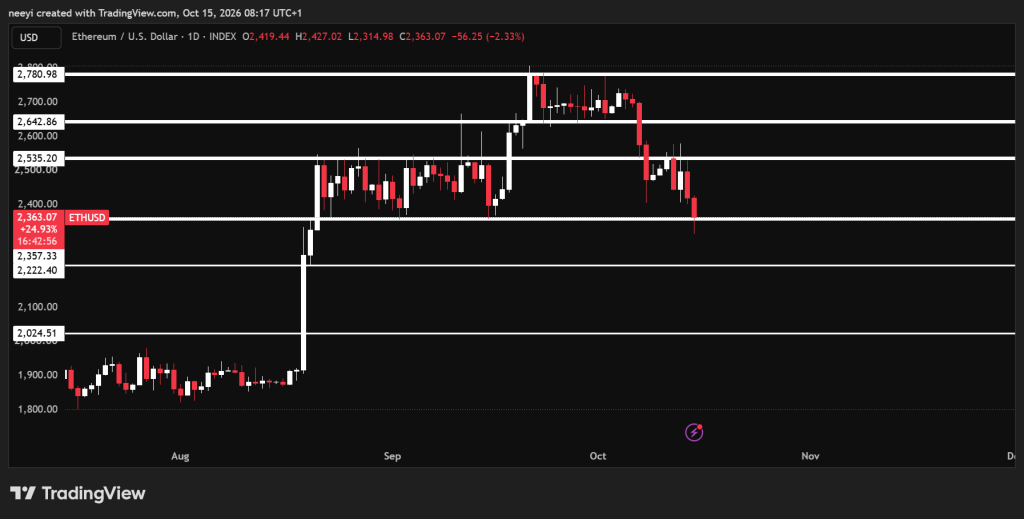
The lower $2,000 region becomes a possible weekly destination if weakness persists. However, the supplied analysis does not establish an exact floor within that region, so a more precise target would overstate the available information.
Ethereum also has a consolidation route. A recovery into the former trading area could allow price to move between $2,350 and $2,550 through the rest of the week.
The lower boundary requires careful interpretation because $2,350 is slightly below the broken $2,360 support. ETH would need to stabilize around this area and recover the former floor before that range becomes convincing.
A sustained break above $2,550 would improve the bullish case. No higher Ethereum target was provided, so the clearest test is whether buyers can overcome that resistance and hold above it.
| Asset | Immediate Support Test | Downside Scenario | Extended Weekly Risk | Recovery Hurdle |
|---|---|---|---|---|
| Bitcoin | Around $80,000 To $80,400 | $77,000 | $74,000 | $83,400 |
| Ethereum | Recovery Of Around $2,360 | $2,220 | Lower $2,000 Region | $2,550 |
Forced Selling Does Not Guarantee A Lasting Recovery
Ducky characterized the liquidation wave as forced selling rather than distribution. That interpretation explains how leverage can accelerate a decline, although liquidation data alone cannot rule out selling by spot holders.
The account also described a dormant whale’s transfer of 4,582 BTC into 5 fresh addresses. A transfer between addresses does not establish that those coins were sold, so it cannot independently confirm an exit near local highs.
FAQs
Subscribe to our YouTube channel for daily crypto updates, market insights, and expert analysis.