Silver’s next move could test how much strength remains behind its rally. Rob Kientz of The Freedom Report sees reasons silver could outperform gold, even after its recent pullback. David the Ape has also raised a question that could change the outlook beyond this year: What happens if silver’s supply shortage begins to disappear?
These arguments connect through the same issue. Silver needs enough demand to support higher prices, and its chart needs buyers to defend an important support area. The next rebound could reveal whether those conditions still hold.
What you'll learn 👉
A Possible 2027 Silver Supply Surplus Could Test The Scarcity Argument
David the Ape’s discussion starts with the supply deficits that have supported silver’s investment appeal for several years. His post describes hundreds of millions of ounces drawn from existing stocks since 2021 because newly supplied silver has not fully covered consumption.
A further deficit is expected in 2026. However, David cites a Deutsche Bank forecast that the market could move into surplus by 2027 as solar manufacturers reduce silver usage and supply recovers.
🚨 🚨IS THE 6-YEAR SILVER STORY TURNING AROUND? HERE’S THAT DEVELOPMENT STUCK IN THE MARKET. If gold and silver matter to you, read what I have to say carefully. The silver market has consumed hundreds of millions of ounces in total stock since 2021. A supply deficit is also expected to continue in 2026. But now there’s an interesting development. Deutsche Bank thinks the market could shift to a supply surplus by 2027, with solar panel manufacturers reducing silver usage and supply recovering. In other words, silver’s strongest story that’s been working for years is facing a serious test for the first time. So, is this the end of the bull story? Don’t jump to conclusions that fast. Silver isn’t just an ordinary precious metal. It’s both an investment vehicle and one of industry’s critical raw materials. Demand stretching from electronics to energy infrastructure is the second major force behind the price. Moreover, a significant portion of silver production is tied to the mining of other metals. Mines can’t just start producing more silver the moment the price rises. The real battle is here: Can industry succeed in using less silver, or will new demand offset that savings? If a supply surplus forms in 2027, the market’s balance could shift. But the prediction isn’t certain to come true; the forecasted supply deficit for 2026 is still on the table. The critical point I’m watching is this: Can silver’s story stay built solely on scarcity, or will a new balance form on the demand side? In your view, is the real risk in silver missing the rise, or overlooking changing demand while everyone fixates on the supply deficit? I think industry can’t say NO to silver, and prices will keep heading up in 2027… Please share your comments too.
— David 🥇🦍🥈the Ape (@patato_ass) October 13, 2026
That possibility matters because shortages have been central to the bullish silver price prediction. Continued inventory withdrawals can tighten available supply. A surplus could reduce that pressure and weaken the argument that scarcity alone will keep prices climbing.
A forecast surplus would not automatically mean silver prices must fall. Its size, duration and effect on available inventories would matter. Investment demand could also absorb additional metal.
David remains bullish because silver serves both financial and industrial demand. His argument is that manufacturers may use less silver per product, but growth across electronics and energy infrastructure could offset those savings.
The question therefore becomes more specific: Will total industrial consumption decline, or will expanding production compensate for lower silver usage?
Rob Kientz’s Gold To Silver Ratio Analysis Supports Relative Outperformance
Rob Kientz focuses on the gold to silver ratio as a guide to relative performance. This ratio measures how many ounces of silver equal the price of 1 ounce of gold.
His presentation places the ratio near 68.3, compared with levels around 100 previously. A declining ratio means silver has strengthened relative to gold, although that can happen through different combinations of price movements.
Kientz uses several historical reference points:
- The ratio reached approximately 16 during the 1980 Hunt brothers squeeze.
- The ratio fell to approximately 32 during silver’s 2011 rally.
- The ratio exceeded 120 during the 2020 COVID market disruption.
These extremes provide context, but they do not establish a timetable for another silver rally. Each period involved different financial conditions and market pressures.
Kientz identifies a historical resistance region around 90 to 100 and support around 30 to 45. His bullish argument is that further ratio compression could accompany silver outperformance.
Silver could therefore outshine gold without returning immediately to its previous price peak. Relative strength and an outright price recovery are connected, but they are separate measurements.
Silver Miners Show Why More Resources Do Not Immediately Resolve A Deficit
Kientz’s review of silver miners adds another consideration to the supply debate. Companies can expand resources and reserves without delivering all those ounces to the market immediately.
His presentation describes Hecla Mining’s silver reserves at approximately 231 million ounces, despite production of around 17 million ounces in 2025. He also discusses First Majestic’s larger resource base and Silver X Mining’s resource expansion at Nueva Recuperada.
Those developments could support future production. However, discoveries still require development, financing, permits and operating capacity before they become saleable silver.
Pan American Silver’s acquisition of MAG Silver offers a different example. Kientz describes the transaction as adding exposure to Juanicipio and potentially improving Pan American’s production profile and costs.
An acquisition can increase the buyer’s reported output without creating an equivalent increase in worldwide supply. Ownership changes alone do not produce additional ounces.
Kientz also describes strong cash balances across major miners. That financial capacity could help fund exploration and expansion, but the timing of new production remains essential to any forecast of a 2027 surplus.
Silver Price Prediction Depends On The Rising Trendline Holding
A look at the silver price chart described in the supplied analysis shows a rising trendline that began around April 2025. Silver repeatedly rebounded around that structure before its advance accelerated.
The analysis describes a climb from approximately $28 to $120, followed by a substantial retreat this year. A July rebound developed around $54, and silver has now returned close to the trendline again.
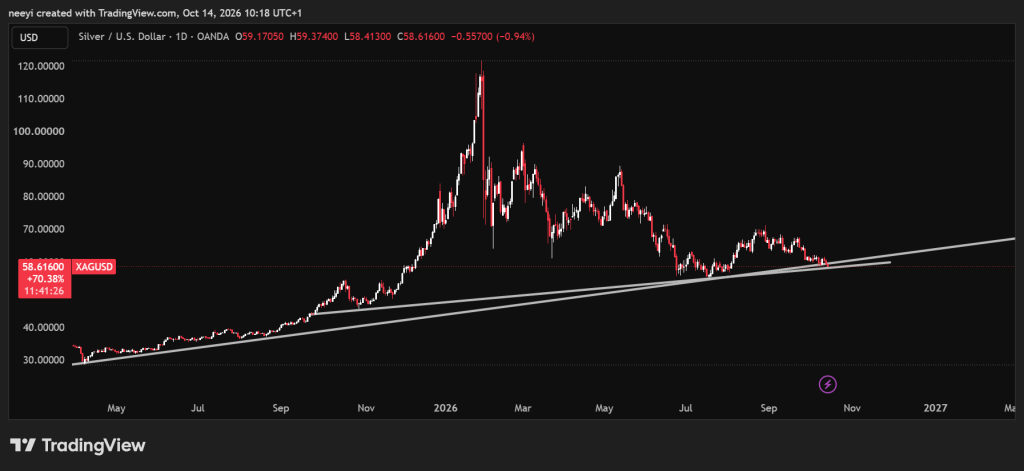
That makes the current area important for the next silver price prediction. Another successful defence could support a recovery from approximately $58 toward $69.
Kientz’s presentation identifies approximately $60 as an important weekly reference and resistance near $62.45. A recovery through that resistance would provide an earlier test before the larger upside targets come into view.
Read Also: SUI Positioned for Economic Singularity, Says Raoul Pal at Basecamp 2026
The main scenarios are:
- A trendline rebound and recovery above nearby resistance could open a path toward $69.
- Continued strength beyond $69 could bring approximately $89 into view before year end.
- A sustained trendline breakdown would weaken the rebound case and return attention to approximately $54.
The higher targets remain conditional. Previous rebounds make the trendline relevant, but they cannot guarantee that buyers will defend it again.
Gold Price Prediction Centres On Support Around $3,900
Gold’s chart provides a useful comparison because its next move also depends on an established support area.
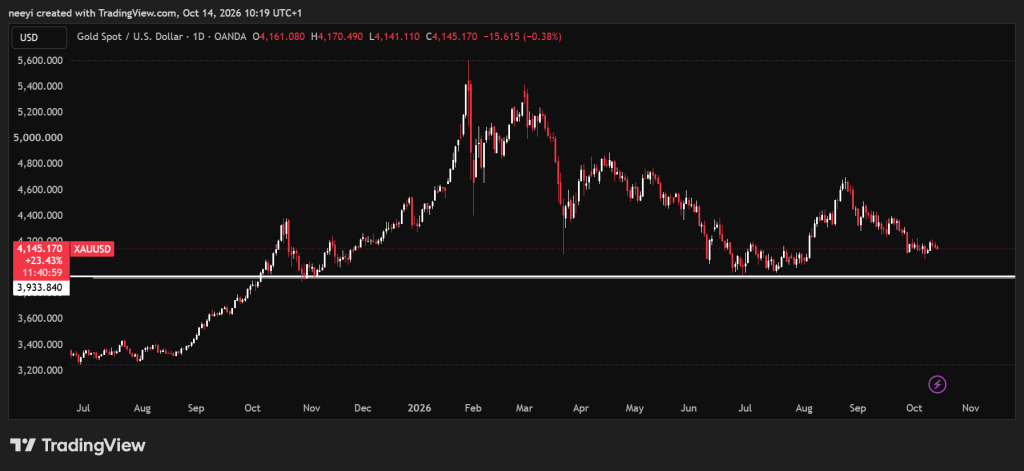
The supplied analysis places that support around $3,900 and describes it as a level that has held since October 2025. Another successful defence could allow gold to recover and continue trading within the $4,000 range through year end.
A sustained break below support would weaken that outlook. The alternative scenario allows for a decline into the middle of the $3,000 range, potentially toward $3,400.
Silver’s larger potential percentage rebound could produce outperformance if its support holds and gold remains comparatively steady. A weaker gold price could also lower the ratio without delivering a strong silver rally.
Subscribe to our YouTube channel for daily crypto updates, market insights, and expert analysis.