
Gold is worth near $4,155, but Bank of America does not expect prices to remain comfortably above $4,000 over the next three months.
The bank’s near-term view is based on weaker physical demand despite continued investment interest. That leaves gold exposed if rates stay elevated, the dollar remains firm, or buyers fail to defend the $4,000 area.
Another analyst, Hamza from ElliottWavesHub, is even more cautious in the short term. His October 13 chart maps a deeper correction before he expects the longer-term bullish trend to resume.
What you'll learn 👉
Bank of America Says Gold May Struggle Above $4,000
Bank of America’s view is not that gold’s long-term story has ended.
Its concern is focused on the next few months.
The bank sees a mismatch between investment demand and weaker physical buying, which could make it difficult for gold to stay above $4,000 if macro pressure remains unfavorable.
That makes $4,000 the first level to watch.
Bank of America is bearish on Gold. Major buy signal.
— Fthegurus (@fthegurus) October 13, 2026
If gold loses that area and cannot recover it quickly, the case for another leg lower becomes stronger.
A move from roughly $4,155 to $3,750 would represent a decline of about 9.7%.
That gives useful context to the scale of the downside BofA appears to be considering.
Read also: Here’s How High Gold and Silver Prices Could Go This Week
Hamza Maps a Deeper Correction
Hamza’s view is more technical.
In his October 13 post, he said gold’s decline is continuing in line with his Elliott Wave count and estimated that the market is roughly halfway through the projected correction.
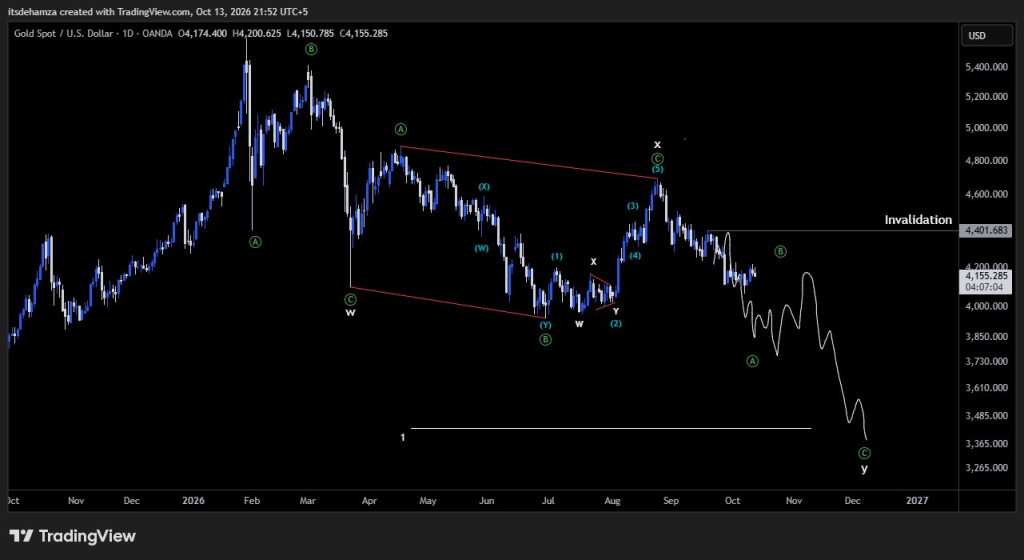
His daily XAU/USD chart on OANDA shows gold near $4,155 and places an invalidation level around $4,401.68.
As long as the gold price stays below that level, his bearish wave structure remains intact.
The chart points first toward the high-$3,000s, then lower toward the $3,500 area, with Hamza’s final projected C-wave zone near $3,365.
From $4,155, a move to $3,365 would equal roughly 19% downside.
That target belongs to Hamza’s Elliott Wave model, not to our own forecast.
What Would Confirm or Invalidate the Bearish Case?
The two views overlap around one central point: gold may still have more downside before the correction is complete.
For Bank of America, the main issue is whether gold can hold above $4,000 over the coming three months.
For Hamza, the technical invalidation level is much clearer.
A sustained move above roughly $4,402 would break the structure shown on his chart and weaken the case for the deeper correction.
On the downside, the levels to watch are:
- $4,000 as the first key support
- around $3,850 as the next area below
- around $3,750, in line with BofA’s downside case
- $3,500 to $3,365 in Hamza’s deeper Elliott Wave scenario
These are conditional paths, not fixed outcomes.
The cleanest level for the gold price remains $4,000.
If gold holds above it and later reclaims the $4,400 area, the bearish case weakens considerably.
If $4,000 fails, both BofA’s near-term view and Hamza’s lower technical targets become more relevant.
For more financial news and price predictions, click here.
Subscribe to our YouTube channel for daily crypto updates, market insights, and expert analysis.