
Bitcoin price enters October 14 trading around $83,400 after recovering from the recent drop toward $80,345.
I analyzed the BTC/USDT two-hour chart on Binance, where Bitcoin is currently trying to stabilize above $83,000 after several volatile sessions. The latest recovery has improved momentum, but BTC still needs to clear the $84,000-$85,000 area before the short-term setup becomes more convincing.
What you'll learn 👉
Bitcoin Chart Analysis
Bitcoin recently fell from the $86,000-$87,000 area to a local low of $80,344.8 before buyers stepped in.
That rebound pushed BTC back above $82,000 and then toward $83,400.
The first resistance area is around $84,000. Price has repeatedly reacted around this zone during the past several sessions.
Above that, $85,000 becomes the next level to watch.
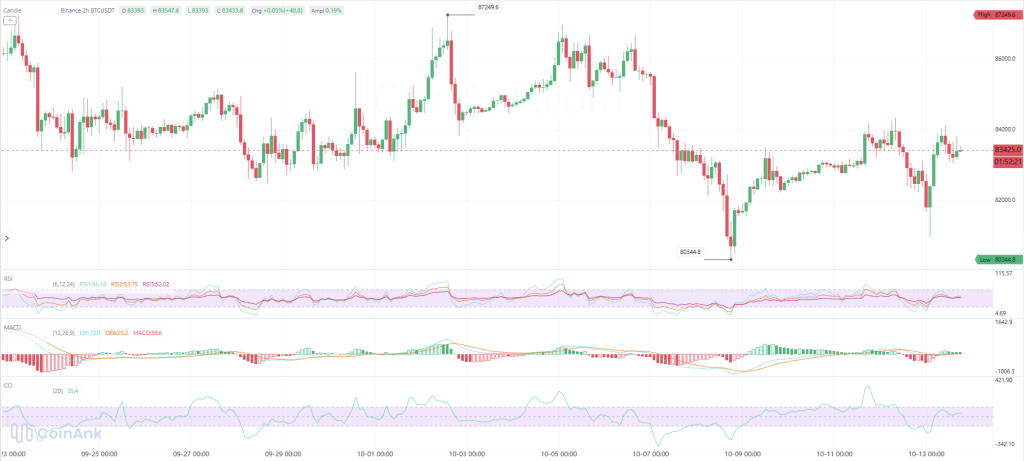
If Bitcoin can reclaim $85,000 on the two-hour chart, our interpretation is that $86,000-$87,250 becomes the next realistic upside area.
On the downside, $82,500-$83,000 is the first support zone.
Below that, $81,500-$82,000 comes back into focus, followed by the recent $80,344.8 low.
A sustained move below $80,345 would invalidate the current rebound thesis and reopen lower levels.
Read also: BlackRock ETF Clients Sell Bitcoin and Ethereum!
What the Bitcoin Indicators Show
Momentum has improved compared with the recent selloff.
The RSI readings visible on the chart are:
- Short RSI: 56.18
- Medium RSI: 53.75
- Longer RSI: 52.02
All three readings are now above 50, which points to a modest advantage for buyers without putting the Bitcoin price close to overbought territory.
MACD has also turned positive.
The chart shows:
- DIF: about 70.0
- DEA: about 25.2
- Histogram: about 89.6
The fast line is above the signal line and the histogram is positive, which supports the current recovery attempt.
CCI is around 35.4.
That is another mildly positive reading, but it is not extreme enough to imply BTC is stretched in either direction.
Taken together, RSI, MACD and CCI currently support stabilization and a possible continuation higher, but price confirmation above $84,000-$85,000 is still needed.
Bitcoin Price Prediction for October 14
These are conditional technical scenarios based on the Binance BTC/USDT two-hour chart, not statistically validated probabilities.
| Scenario | Confirmation | Bitcoin price area |
|---|---|---|
| Bullish | BTC holds above $83K and clears $84K-$85K | $86K-$87.25K |
| Neutral | Price remains trapped below $85K but above support | $82.5K-$85K |
| Bearish | BTC loses $82.5K | $81K-$82K, then $80.35K |
From roughly $83,425, a move to $85,000 would represent about 1.9% upside.
A retest of $80,345 would represent roughly 3.7% downside.
That makes $84,000-$85,000 the key confirmation zone for buyers, with $82,500 acting as the first level they need to defend.
For October 14, Bitcoin’s setup is improving, but the chart still needs a move above $85,000 before a larger recovery toward $86,000-$87,250 becomes more convincing.
For more crypto news and price predictions, click here.
Subscribe to our YouTube channel for daily crypto updates, market insights, and expert analysis.