
Hedera price has pulled back heavily over the past two weeks, falling roughly 24% from its September 28 close and moving back toward the $0.09 area.
But analyst Lana Valentis believes the weekly Hedera chart may be setting up for another strong move higher.
Her thesis is based on two things: a retest of a major support and resistance zone, and fresh growth in Hedera’s tokenization story.
What you'll learn 👉
HBAR Is Retesting a Major Weekly Zone
Valentis’ chart puts the current battle around $0.084 to $0.093.
That area acted as an important pivot before and is now being tested again after the latest correction.
The structure on her chart resembles a rounded base, with HBAR recovering from the summer lows and then pulling back into the same zone.
If buyers defend this area, the first upside target is around $0.13.
Above that, the chart maps additional levels at $0.20, $0.31 and eventually $0.40.
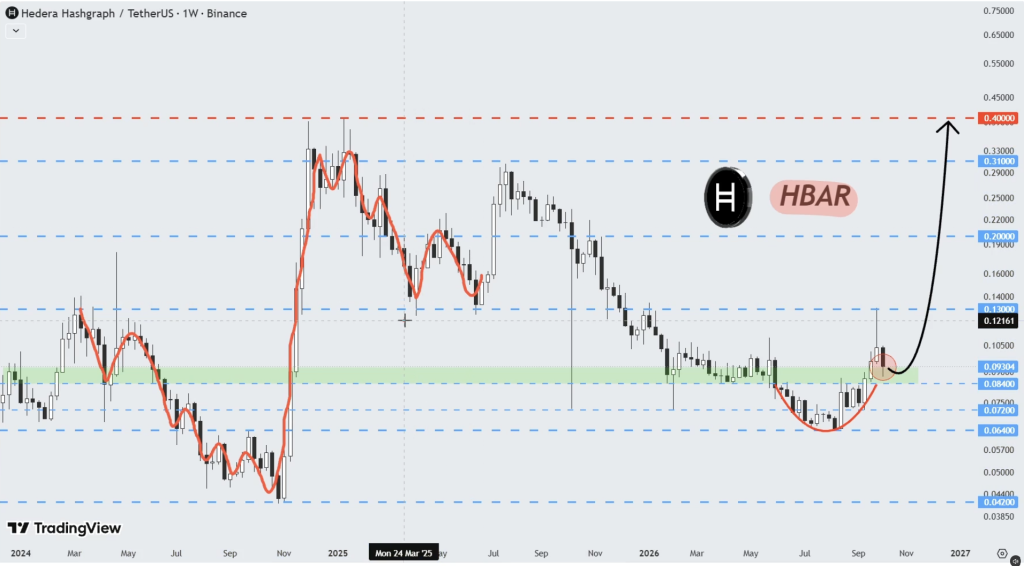
The $0.13 level is the most realistic first test because it lines up with a previous resistance area and recent swing structure.
Tokenized Stocks Add to the Hedera Story
Valentis also points to Hedera’s growing tokenization use case.
Users can now access tokenized equity exposure through HashPack and SODAX, adding another real-world asset angle to the network.
That fits Hedera’s broader push into institutional-grade tokenization and enterprise infrastructure.
The market had already reacted positively in late September after The Hashgraph Group’s IDTrust was validated and listed in the IBM Cloud Catalog.
That development remains intact, but it should not be treated as proof that IBM itself is directly adopting HBAR or that it automatically creates token demand.
The latest 24% retracement shows that positive ecosystem news alone is not enough to keep price moving higher without technical support.
Read also: We Asked 3 AI Models If Hedera Price Can Reach $1 in 2027
Hedera Price Prediction
The main level to watch is around $0.084 to $0.09.
If HBAR holds that zone and starts recovering, $0.13 becomes the first major target.
A stronger move through $0.13 could bring $0.20 into focus, followed by the much more ambitious $0.31 and $0.40 levels from Valentis’ chart.
If the support fails, however, the setup weakens quickly.
For now, the chart is interesting because HBAR has returned to a historically important area after a large pullback.
The bullish case depends on buyers proving they can defend it.
Subscribe to our YouTube channel for daily crypto updates, market insights, and expert analysis.