Kaspa is entering a much more balanced part of its market structure, with analyst J3 now viewing the higher-timeframe setup as neutral rather than outright bearish.
In his latest update, J3 said KAS is effectively trading inside a large range between roughly $0.024 and $0.063.
A clean move beyond either side would help define whether the macro bear trend has truly ended.
For now, he sees the odds that the bottom is already in as slightly better than even.
What you'll learn 👉
J3 Sees a 60/40 Chance the Bottom Is In
J3 said the higher-timeframe structure is currently neutral, meaning both bullish and bearish setups remain valid.
That changes above $0.063 or below $0.024.
A sustained move above $0.063 would support the view that the $0.024 area marked the macro bottom.
A move below $0.024 would instead open the door to one more major accumulation phase.
The analyst put the odds of the bottom already being in at around 60/40.
That is not a strong conviction call, but it is still a notable shift after months of bearish structure.
Mid-Timeframe Structure Is Still Bullish
The picture looks better on the medium timeframe.
J3 said the structure remains bullish as long as KAS holds above the $0.038 swing.
The chart shows several support zones formed during the recent move higher, giving buyers potential entry areas if the token pulls back.
The first area to watch is around $0.040.
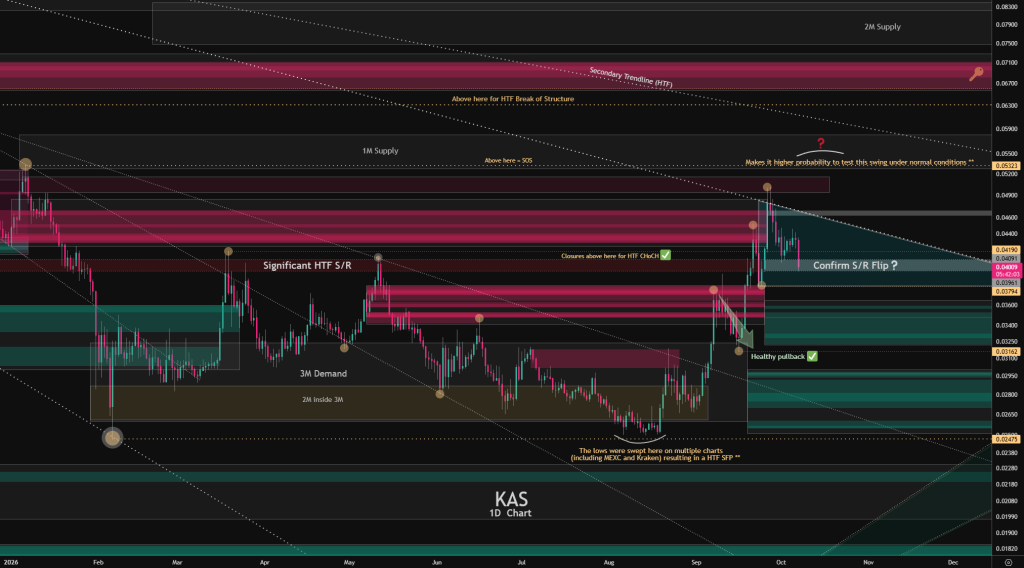
This region lines up with the support and resistance zone marked on the chart and is close to the current Kaspa price structure.
If KAS holds that level, the short-term bullish structure remains intact.
If it loses $0.038, the setup becomes weaker and lower support zones become more important.
Kaspa Price Forecast: $0.053 Is the First Major Upside Target
J3 also identified $0.053 as an important swing level.
Kaspa could still move into that area before any deeper correction.
A move above the nearby trendline would increase the probability of a push toward that zone.
Above $0.053, the chart shows a larger supply region between roughly $0.053 and $0.083.
That means KAS could theoretically move much higher without fully confirming a new macro bull trend.
This is an important part of J3’s outlook.
Even if the Kaspa price reaches the upper supply zones, price behavior around $0.063 remains crucial.
Why $0.063 Matters So Much
The $0.063 level is the main macro threshold.
J3 sees a move above it as a higher-timeframe break of structure.
If KAS can close above that level and hold it, the argument that the macro bottom formed near $0.024 becomes much stronger.
Below that level, the broader range remains unresolved.
That means price could still rally substantially and yet remain technically neutral on the larger timeframe.
Read also: Can Kaspa (KAS) Reach $1? Here’s What the Math Says
What Happens If KAS Breaks Lower?
The downside scenario is also clearly defined.
If KAS loses $0.024, J3 believes the next likely bottoming area would sit between roughly $0.021 and $0.015.
He now considers prices below $0.013 unlikely unless something catastrophic happens.
That gives the current setup a much clearer downside framework than before.
The analyst is effectively saying that even if the current bottom fails, the likely final accumulation zone may not be much lower.
Kaspa Price Outlook
The chart now comes down to a few major levels.
| Level | Meaning |
|---|---|
| $0.040 | Immediate support and S/R area |
| $0.038 | Key level for medium-timeframe bullish structure |
| $0.024 | Macro range floor |
| $0.053 | First major upside swing target |
| $0.063 | Macro break-of-structure level |
| $0.053-$0.083 | Major overhead supply zone |
| $0.021-$0.015 | Likely deeper bottoming zone if $0.024 fails |
The near-term structure remains constructive as long as KAS holds above $0.038 to $0.040.
A move through the current trendline could open the path toward $0.053.
The bigger confirmation comes at $0.063.
If Kaspa eventually clears that level and holds it, the probability that the macro bottom is already behind it would increase significantly.
For now, J3 sees the market in a large neutral range, but with a slight probability edge toward the idea that the bottom may already be in.
For more crypto news and price predictions, click here.
Subscribe to our YouTube channel for daily crypto updates, market insights, and expert analysis.