Gold and silver are heading into October at important technical levels after falling from their recent highs. The silver price is around $60.98, down 0.29% on the latest 4-hour candle, after dropping from the $72 area. The gold price is around $4,155.75, down 0.55%, after pulling back from the $4,800 zone.
The charts remain bearish on the 4-hour timeframe, but there are still several factors that could influence both metals in October. Softer inflation has cooled expectations for an October Fed rate hike. But elevated Treasury yields and a stronger dollar are still creating pressure.
Kitco reported gold trading near $4,181.80 and silver near $61.09 during Thursday’s session. Markets are also watching U.S. jobless claims, Treasury yields, and the ongoing oil-market pressure tied to the Strait of Hormuz situation.
Gold, silver rise as jobless claims temper PCE-driven Fed repricing – Kitco AM Report
— Kitco NEWS (@KitcoNewsNOW) October 1, 2026
(Kitco NewsWire) – Spot #gold and #silver prices were higher in early U.S. trading Thursday, as soft inflation data kept October Fed-hike expectations below earlier-week levels, while this…
What you'll learn 👉
The Silver Price Needs to Clear $62
We had a look at the silver chart, and $62 is the first level that matters for October. The silver price is trading near $60.98, putting it just below that resistance. The first major support is $58, followed by $56 and the broader $54 support zone.
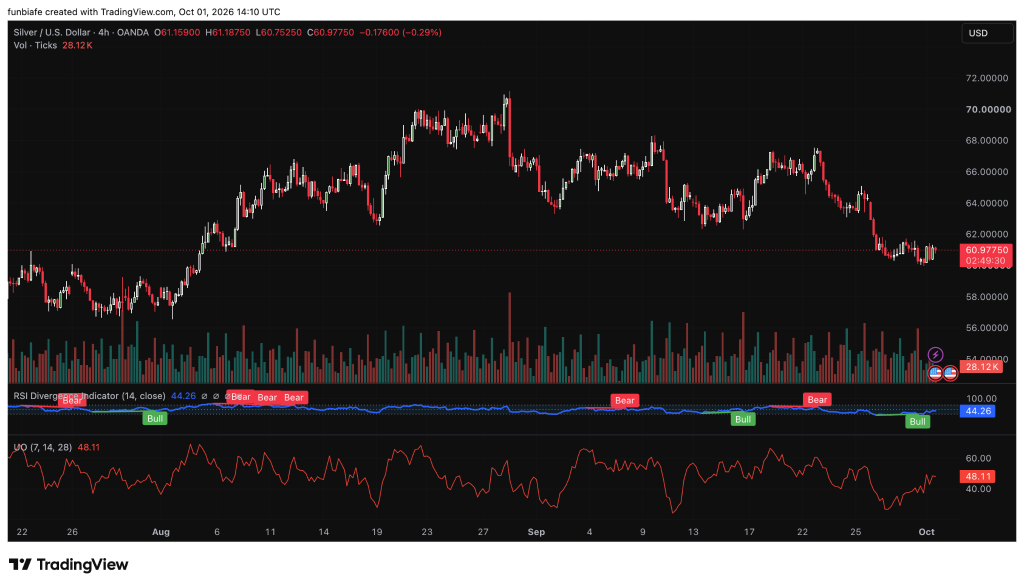
Momentum remains weak. The 4-hour RSI is 44.26, below the neutral 50 level, and the Ultimate Oscillator is 48.11. The chart also shows five bearish divergence labels compared with two bullish labels.
A move above $62 would put $64 and $66 into focus, followed by $68, $70 and eventually $72. If the silver price fails to break $62 and falls below $58, the next levels to watch would be $56 and $54.
There is also a fundamental side to the silver price outlook. Morgan Stanley’s Amy Gower said silver’s previous run toward $120 was supported by more than speculation, pointing to strong demand from areas such as solar and ETFs. She also noted that higher prices and volatility have affected industrial demand.
The Gold Price Is Testing $4,200
The gold price is facing a similar setup. Gold is trading around $4,155.75, with $4,200 acting as the first resistance level. A break above it would put $4,300 and $4,400 into focus, followed by $4,500, $4,600, $4,700 and $4,800.
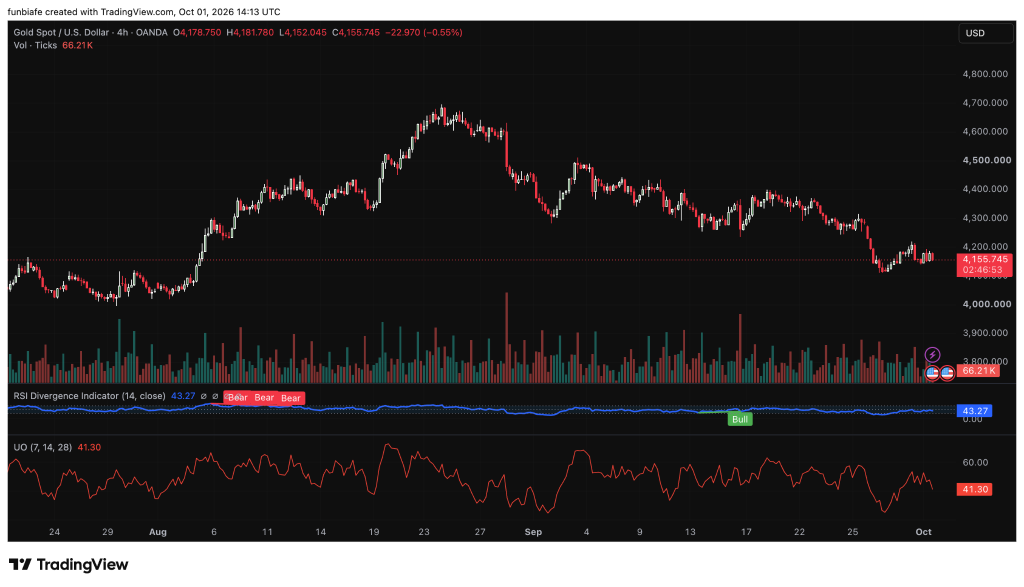
The downside levels are also clear. $4,100 is the first major support, followed by $4,000, $3,900 and $3,800. The indicators remain bearish. Gold’s 4-hour RSI is 43.27, and its Ultimate Oscillator is 41.30. Both are below 50. The chart also shows four bearish divergence labels and one bullish label.
The fundamental picture gives gold some support, though. Morgan Stanley’s Gower said central-bank demand remains strong and that ETF demand has held up despite higher interest-rate expectations. She also expects the gold price to return above $5,000 per ounce in the second half of 2027.
Read Also: Why This Gold and Silver Sell-Off May Be More Bullish Than It Looks
Bitcoin Is Another Factor for Gold
There is also an interesting development involving Bitcoin. Coin Bureau shared comments from Bitwise head of research Ryan Rasmussen, who said some sovereign wealth funds are selling gold and foreign-exchange reserves to fund Bitcoin allocations.
🚨BULLISH: Sovereign wealth funds are reportedly selling GOLD to buy Bitcoin.
— Coin Bureau (@coinbureau) September 30, 2026
Bitwise's head of research Ryan Rasmussen says major institutions increasingly hold Bitcoin alongside gold as a hedge against currency debasement.
The firm's first institutional survey found none of… pic.twitter.com/zBzwsvPC7s
Bitwise’s first institutional survey covered 15 major institutions. None of the people interviewed sold their crypto during Bitcoin’s drop from around $125,000 to $60,000. Several actually added to their holdings.
Rasmussen said institutions are increasingly holding Bitcoin alongside gold as a hedge against currency debasement. This does not mean Bitcoin is replacing gold, but it does show that institutional investors have another asset competing for capital in the same macroeconomic conversation.
Gold and Silver Price Outlook for October
The $62 silver level and $4,200 gold level could define the early October setup. If both metals break above these levels, the next resistance zones come into view. A break below $58 for silver or $4,100 for gold would expose the lower support levels.
For now, the technical picture remains bearish, with both metals below key resistance and their momentum indicators below 50. At the same time, central-bank demand, ETF flows, inflation expectations and geopolitical risks could give the gold price and silver price room to recover.
FAQs
Subscribe to our YouTube channel for daily crypto updates, market insights, and expert analysis.