
Bitcoin and Ethereum are heading into October with very different charts from where they started the summer.
Bitcoin is trading around $83,700, still comfortably above its 200-day moving average and only a few thousand dollars below the September high near $87,000. Ethereum is holding close to $2,690 after a strong run from below $2,000 in August.
Both assets have cooled after their recent rallies, though neither chart currently looks broken. Momentum has moved back toward neutral territory, and October could come down to whether buyers can defend the higher ranges created during August and September.
There are also several fundamental factors that could influence the next move, including Bitcoin ETF flows, a shift toward altcoins, Ethereum’s upcoming protocol work, and changing exchange balances.
What you'll learn 👉
Bitcoin Chart Analysis
Bitcoin’s four-hour chart shows a major change from the first half of the year.
BTC spent much of May through August below its 200-day moving average, which was trending lower at the time. That changed in August when Bitcoin moved rapidly from the mid-$60,000s toward the upper-$70,000s.
Since then, the structure has remained much stronger.
Bitcoin reached roughly $87,000 in late September before pulling back toward its current price near $83,700.
The first thing that stands out is that BTC remains far above its 200-day moving average, which sits near $71,265 on the chart.
That leaves a large cushion between current price and the longer-term trend indicator.
The more immediate issue is momentum.
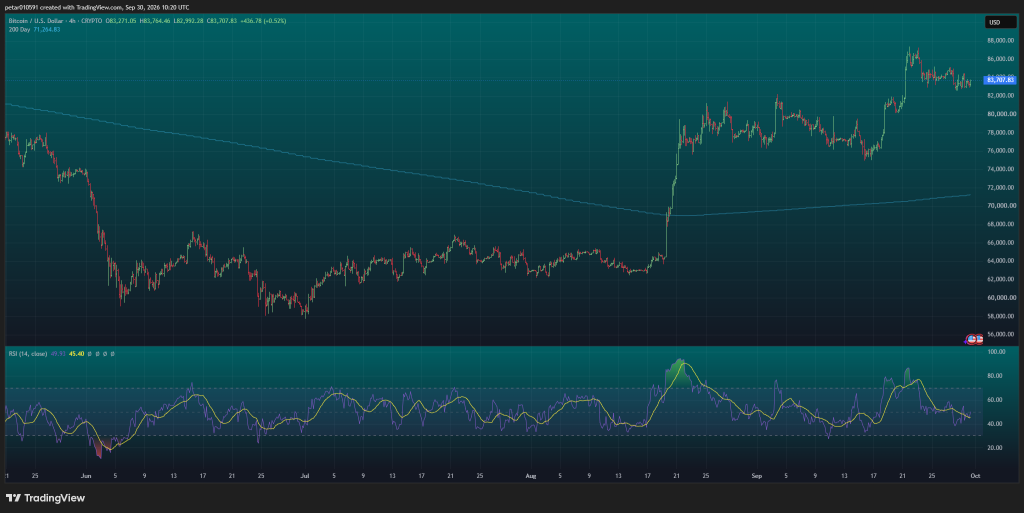
The four-hour RSI is near 50, putting Bitcoin almost exactly in neutral territory. That is very different from the overbought readings seen during the September rally.
In other words, the market has cooled without giving back the majority of the recent advance.
The nearest resistance sits around $85,000-$87,000. Bitcoin has already struggled there several times, making that region the first hurdle for October.
If BTC can reclaim $87,000 and hold above it, the chart opens the door to another attempt at higher levels.
On the downside, the first area worth watching is around $82,000.
Below that, $78,000-$80,000 becomes much more important because it acted as a major trading area during late August and early September.
Bitcoin ETF Demand Remains Strong
Institutional demand continues to provide support.
U.S. spot Bitcoin ETFs currently hold around $110.97 billion in assets, up from approximately $100.39 billion a month earlier.
That increase points to continued institutional accumulation during the recent BTC recovery.
ETF flows, however, are not guaranteed to remain positive.
Large inflows can quickly reverse when macro conditions change, especially if Treasury yields rise, the dollar strengthens, or risk appetite weakens.
That means ETF demand remains an important support factor, but it can also become a source of volatility if investors suddenly begin reducing exposure.
Another interesting development is happening outside Bitcoin.
The CMC Altcoin Season Index has risen from 26 to 61 in only 30 days, showing that capital has increasingly moved toward altcoins.
That does not necessarily hurt Bitcoin immediately, but it can reduce BTC’s relative dominance when traders begin searching for higher returns elsewhere in the market.
At the same time, the Fear & Greed Index sits at 67, still firmly in “Greed” territory but below last week’s reading of 74.
That combination shows a market that remains optimistic but is becoming less euphoric.
Bitcoin Price Prediction for October
Bitcoin enters October with a constructive chart, but $87,000 remains the key level.
If buyers push through that area, BTC could move toward $90,000-$92,000 during October.
A stronger move could extend toward $95,000, particularly if ETF inflows remain positive and broader risk sentiment improves.
The neutral RSI also gives Bitcoin room to move higher without immediately becoming stretched.
The bearish scenario begins if BTC loses the $82,000 region.
That could send price back toward $78,000-$80,000, where buyers would likely face a much more important test.
For now, a reasonable October range appears to be roughly $78,000 to $92,000, with $87,000 deciding whether Bitcoin can extend the September rally.
Ethereum Chart Analysis
Ethereum’s chart looks even more dramatic than Bitcoin’s.
ETH traded below $1,600 in June before gradually recovering through July and early August.
The real change arrived around August 20.
Ethereum moved quickly from below $2,000 toward $2,400 and continued higher through September.
ETH eventually reached approximately $2,800, its highest level visible on the chart, before cooling back toward the current price around $2,689.
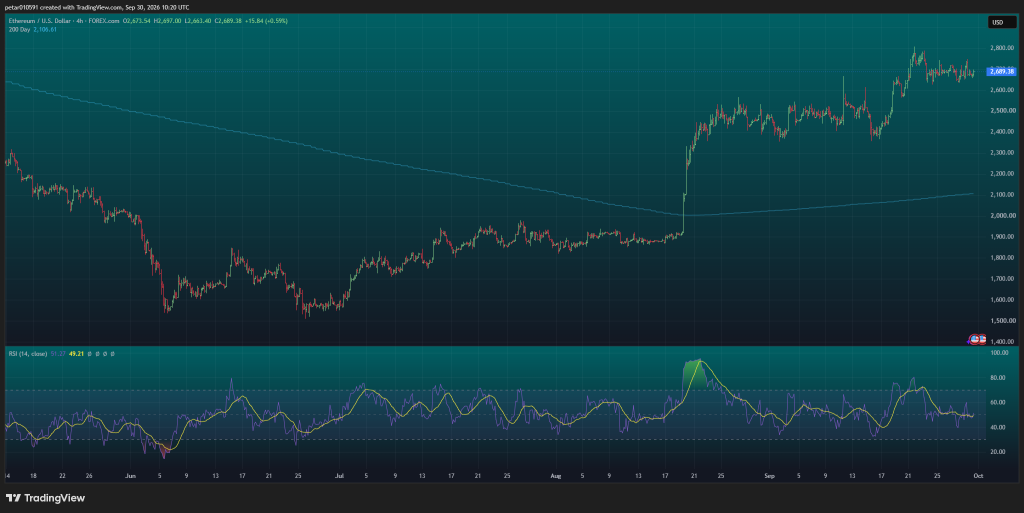
Just like Bitcoin, Ethereum remains comfortably above its 200-day moving average.
That average sits near $2,106, giving ETH a large buffer before the longer-term structure would come under real pressure.
The four-hour RSI is around 51, also almost perfectly neutral.
That tells us Ethereum is consolidating after the September advance rather than showing extreme momentum in either direction.
The first major resistance sits between $2,750 and $2,800.
Ethereum has already struggled around that region, so clearing it would be an important step.
If ETH gets through $2,800, $3,000 becomes the obvious psychological target.
Support sits around $2,600, followed by a stronger area around $2,450-$2,500.
Ethereum’s Roadmap Could Become a Bigger Story
Ethereum’s longer-term development roadmap remains one of the strongest fundamental arguments behind ETH.
The network is working through a multi-year “strawmap” that targets roughly seven major upgrades through 2029.
The next major hard fork, Glamsterdam, is currently planned for the fourth quarter of 2026.
Its main goals include parallel execution and enshrined proposer-builder separation, or ePBS.
Parallel execution is designed to allow Ethereum to process more activity at the same time rather than handling transactions sequentially.
ePBS focuses on improving how blocks are built and proposed, with the goal of making the network more efficient and reducing some of the centralization risks around block production.
The broader roadmap aims for much higher Layer 1 capacity, faster finality, and stronger privacy features.
Ethereum developers have discussed long-term goals that could eventually push base-layer throughput toward 10,000 transactions per second, though reaching that level will require several stages of upgrades.
These improvements could become increasingly important as Ethereum competes with faster Layer 1 networks such as Solana.
Exchange Balances Are a Short-Term Concern
There is one piece of data that could create some pressure.
Ethereum exchange balances recently increased by roughly 125,000 ETH.
When more ETH moves onto exchanges, it can indicate that holders are preparing to sell, although exchange inflows do not automatically result in immediate selling.
That makes the increase worth monitoring, especially after ETH’s strong run since August.
On the other side, large entities continue to accumulate.
BitMine reportedly holds close to 6 million ETH, giving Ethereum another source of long-term institutional demand.
Ethereum dominance currently sits around 11.43%, leaving ETH well below Bitcoin but still far ahead of most altcoins.
The challenge is that Ethereum increasingly has to compete for developers, users and transaction fees with Solana and other Layer 1 networks.
Ethereum Price Prediction for October
Ethereum’s October setup looks fairly straightforward.
The first major test is the $2,800 area.
If ETH moves above that level and holds, $3,000 becomes the next likely target.
Above $3,000, a stronger October rally could push Ethereum toward $3,150-$3,250.
The neutral RSI leaves plenty of room for that scenario.
If Ethereum instead loses $2,600, the next major area sits around $2,450-$2,500.
That region would likely determine whether the August and September rally remains intact or starts turning into a deeper correction.
For October, the most realistic range looks to be roughly $2,450 to $3,050.
Both Bitcoin and Ethereum therefore enter the new month from relatively strong positions, but neither has yet cleared the resistance that would confirm another leg higher.
Bitcoin needs to get through the $85,000-$87,000 region, while Ethereum needs to move beyond $2,800.
If those levels fall, October could extend the rally that began in August. If they continue rejecting price, both assets may spend much of the month consolidating before the market chooses its next direction.
For more crypto news and price predictions, click here.
Subscribe to our YouTube channel for daily crypto updates, market insights, and expert analysis.