
Gold price is under heavy selling pressure today, and extended a difficult stretch that has pushed the precious metal to its lowest price since early August. XAU/USD has fallen below $4,200, with the chart provided showing gold trading around $4,174 at the time of capture.
The latest decline comes despite evidence that central banks may be accumulating considerably more gold than official purchase figures indicate. Goldman Sachs estimates put central bank buying at 44 tonnes in July, while officially reported purchases came in at only 23 tonnes.
That leaves gold in an interesting position. Its short-term chart has deteriorated considerably, while one of the major sources of longer-term demand remains unusually strong.
What you'll learn 👉
Central Banks May Be Buying Much More Gold Than Reported
The Kobeissi Letter highlighted the difference between reported central bank purchases and estimates produced by Goldman Sachs.
Goldman’s nowcast puts global central bank purchases at 44 tonnes in July, compared with a pre-2022 monthly average of just 17 tonnes. That makes July’s estimated buying roughly 158% higher than the earlier average.
The three-month seasonally adjusted rate is even more notable. It has reached approximately 91 tonnes per month, placing recent buying near its highest pace since mid-2025.
Meanwhile, the longer 12-month average has remained around 50 to 60 tonnes per month.
The discrepancy comes when those estimates are compared with officially disclosed purchases. Reported central bank buying totaled only 23 tonnes in July, leaving a 21-tonne difference versus Goldman’s estimate.
China appears to account for a large part of that gap. Goldman analysts estimated Chinese purchases at roughly 35 tonnes during July, while publicly reported numbers were considerably lower.
This raises the possibility that official statistics are giving investors an incomplete picture of sovereign gold demand.
Central banks are likely buying way more gold than official figures suggest:
— The Kobeissi Letter (@KobeissiLetter) September 27, 2026
World central banks acquired +44 tonnes of gold in July, +158% above the pre-2022 average of +17 tonnes, according to Goldman Sachs.
This brings the 3-month average of purchases to +91 tonnes, near its… pic.twitter.com/GCsCYxLbKq
For the longer-term gold outlook, that is an important distinction. If central banks are accumulating bullion faster than disclosed, underlying physical demand could be stronger than headline figures make it appear.
Goldman Sachs still has a $4,900 end-2026 fair-value forecast for gold, built partly around continued central bank purchases and a recovery in ETF demand. The bank has also identified upside risks to that target.
Yet none of this has been enough to stop gold’s current sell-off.
Why Is Gold Price Crashing Today?
The immediate problem for gold comes from the macro environment.
Oil prices have risen as uncertainty around the Strait of Hormuz continues, renewing inflation concerns. Higher energy prices make it more difficult for the Federal Reserve to ease monetary policy and have strengthened expectations that US interest rates could remain elevated or rise further.
That combination is particularly uncomfortable for gold.
Higher Treasury yields increase the opportunity cost of holding a non-yielding asset such as bullion. The stronger interest-rate outlook has also supported the US dollar, adding another source of pressure.
These aren’t entirely new forces. Gold had already been struggling with the same combination of Fed policy expectations, yields and the dollar during September. Reuters reported last week that growing expectations for further Fed tightening were weighing on bullion, while markets were assigning a high probability to another rate increase later this year.
Monday’s move has taken that weakness further. Gold dropped below $4,200 during Asian trading, reaching its lowest level since August 5.
Read also: Here’s Why Gold Price Is Getting Wrecked Right Now
Gold Price Chart Turns Bearish
The four-hour chart doesn’t look particularly comfortable for gold bulls.
Gold is trading around $4,174, well beneath its 200-day moving average shown near $4,543 on the provided chart. More importantly, the recent structure has developed into a sequence of lower highs and lower lows.
After reaching roughly $4,670 in late August, gold dropped toward $4,280 at the beginning of September. The subsequent recovery failed around the $4,450 area.
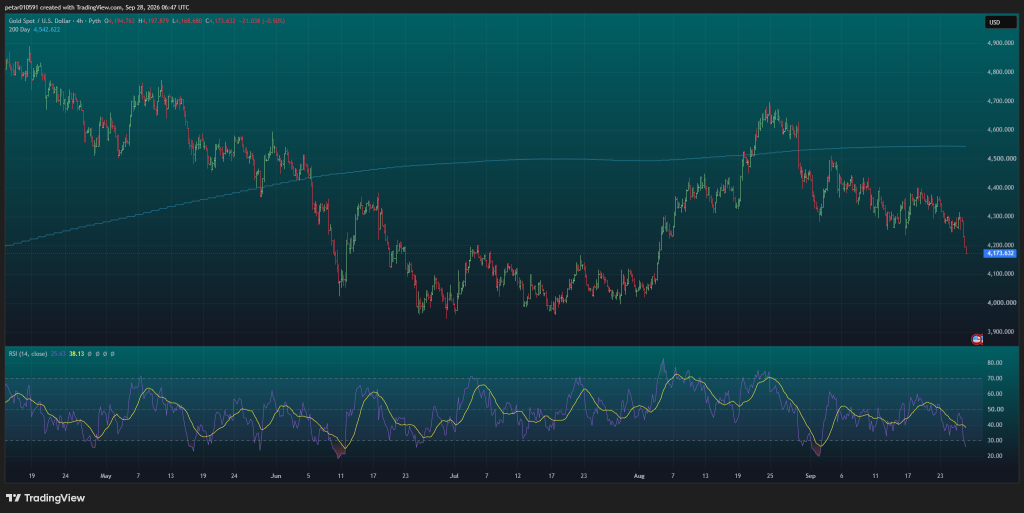
Another attempt higher stalled below $4,400 in the middle of September, followed by the decline now taking gold toward $4,170.
That leaves sellers firmly in control of the immediate trend.
There is another important detail on the chart: RSI has fallen to roughly 25.6.
That puts the four-hour RSI below the commonly watched 30 level and into oversold territory. It doesn’t automatically mean the bottom is in, but it does increase the possibility of a short-term relief move after such persistent selling.
Short-Term Gold Price Outlook
The first area to watch is $4,150-$4,100.
Gold is already approaching this region, and it previously saw considerable trading activity around $4,100 during June and July. If buyers return while RSI remains oversold, a relief move toward $4,250-$4,300 would be possible.
Above there, $4,350-$4,400 becomes a much tougher area. Gold repeatedly traded around this region during September, and former support can now act as resistance.
The bigger technical obstacle sits around the 200-day moving average near $4,540. Gold would need a substantial recovery before that level becomes relevant again.
The downside deserves just as much attention.
If $4,100 fails to hold, the psychological $4,000 level becomes the next major area visible on the chart. Gold spent much of July trading around $4,000-$4,100, making this an important zone for buyers to defend.
For now, the short-term picture remains weak despite an oversold RSI. Central bank accumulation provides a powerful longer-term demand story, but today’s market is being driven by interest rates, bond yields, oil and the dollar.
That leaves gold caught between heavy sovereign demand underneath the market and a macro environment that continues to punish the metal in the short run.
For more financial news and price predictions, click here.
Subscribe to our YouTube channel for daily crypto updates, market insights, and expert analysis.