


In our last Bitcoin daily prediction, we said the BTC price could consolidate between $78,400 and $80,000, with $79,600 acting as the key level for a move toward $80,400 and $81,500.
BTC did not sustain that recovery, and the price remains around $78,656.16, keeping the bearish pressure below $79,600 intact.
The market also has fresh catalysts to digest, with US PPI data and unemployment claims due today. Core PPI is forecast at 0.3%, up from 0.2%, PPI is expected at 0.4% versus 0.0%, and unemployment claims are projected at 205,000 compared with 206,000. So, where can the Bitcoin price go today?
What you'll learn 👉
News That Could Push Bitcoin Price Today
US economic data is the biggest immediate catalyst for the Bitcoin price. Core PPI is expected to rise to 0.3% month-on-month, compared with 0.2% previously, and headline PPI is forecast at 0.4%, up from 0.0%.
Stronger-than-expected inflation data could increase pressure on risk assets, whereas softer numbers could improve the environment for Bitcoin.
Bitcoin also faces supply pressure from public miners. They reportedly sold between 28,000 and 32,000 BTC during the first half of 2026, worth around $1.78 billion at the time.
Much of that capital supported miners’ expansion into artificial intelligence and high-performance computing, with more than $70 billion committed to those sectors, creating another source of Bitcoin supply that traders need to monitor.
What Is the Bitcoin Chart Showing Today?
We had a look at the chart, and the BTC price remains below the $79,611 4-hour swing high identified in the latest market structure.
The price climbed toward the $80,500 area earlier in September before sellers pushed it lower, and the latest candles remain beneath the $79,500-$79,600 resistance region. This keeps the immediate structure cautious until buyers reclaim that area.
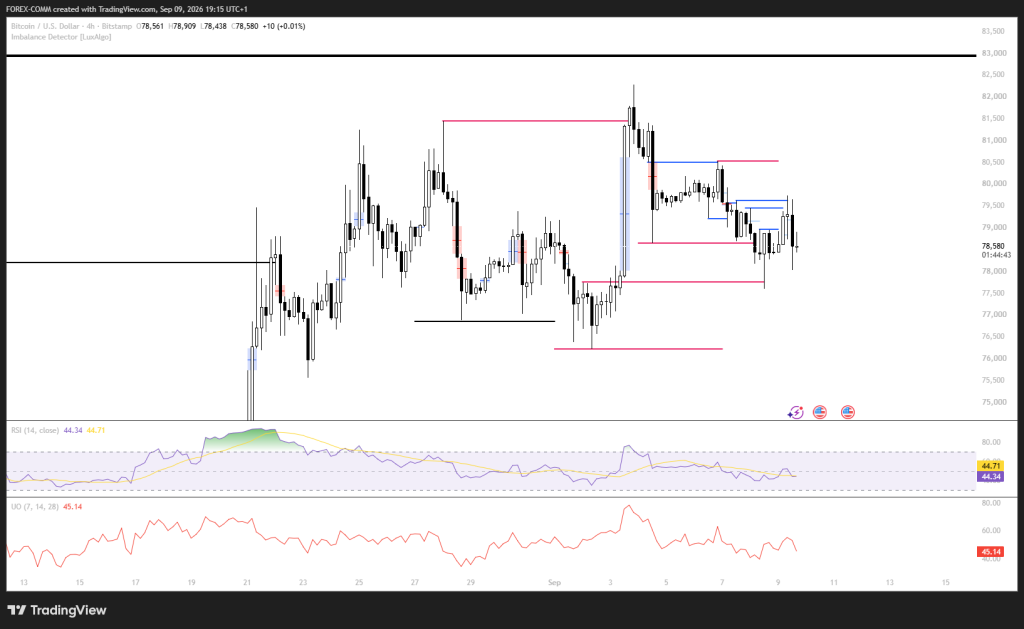
The chart also shows resistance around $80,516, followed by the larger $83,000 level marked at the top of the setup. Between the current Bitcoin price and $80,516, the market has several smaller resistance areas around $79,000-$79,700. A clean move through $79,611 would therefore give buyers room to test $79,741 and then $80,516.
Momentum indicators are not giving buyers a strong advantage yet. The RSI is 44.34, below the 50 midpoint and slightly under its moving average at 44.71, showing that momentum remains subdued. The Ultimate Oscillator is 45.14, also below 50, reinforcing the lack of strong bullish momentum at the current Bitcoin price.
The recent candles also show repeated attempts to recover above $79,000 being met by selling pressure. The Bitcoin price has moved from the upper $80,000 region toward the $78,000 area, then recovered, but the rebound has not yet cleared the key $79,611 swing high. As a result, the next reaction around $78,031 and $77,615 could determine whether BTC finds another recovery or opens a deeper downside path.
Related Bitcoin News: Bitcoin Price Warning: BTC May Have Just Flashed a False Bull Market Start
Where Will Bitcoin Price Go Today?
The Bitcoin price is reacting from the $79,611 4-hour swing high, making $78,031 the first downside objective and $77,615 the second.
If either level attracts buyers and holds, the Bitcoin price could return toward $79,741, followed by the daily high at $80,516. A break above $80,516 would open the door toward the major $83,000 resistance.
The bearish case becomes stronger if $78,031 and $77,615 fail to hold. That would expose the Bitcoin price to the $76,000 area, with $72,000 becoming the deeper target if selling pressure continues.
For September 10, the key levels are therefore $79,611 on the upside and $77,615 on the downside, with US PPI providing a potential catalyst for whichever side breaks first.
Frequently Asked Questions
Subscribe to our YouTube channel for daily crypto updates, market insights, and expert analysis.






