Silver is ending August 2026 with a powerful 15% rally, setting up an important test as September begins. The silver price is holding above $66, with the TradingView chart showing a session high of $67.099 and price around $66.845.
The move marks a strong recovery from the mid-$50 area reached in June and July. Silver started August near the upper-$50s before buyers pushed through the $60 and $62 areas and into the high-$60s.
However, the rally has now reached a major monthly imbalance between $69 and $71. That zone could decide whether the silver price continues toward $80 or returns toward the lower levels marked on the weekly chart.
What you'll learn 👉
Why Silver Price Pulled Back From $72
Silver’s move toward $72 ran into a major resistance area. The weekly chart shows a horizontal resistance zone around $71-$72, where the latest recovery has stalled.
The catalyst for the pullback came from Federal Reserve Chair Kevin Warsh’s Jackson Hole speech on August 28. Warsh said the Fed’s 2% inflation objective remains a “firm, fixed” target and argued that financial conditions were not restrictive enough. He also said policymakers still had “work to do” if inflation was not moving toward 2% clearly and quickly enough.
The reaction was immediate. Markets lifted the probability of a September rate hike from about 35% to 57%, according to Reuters, and the latest CME FedWatch reading cited by Reuters on August 31 puts the probability at 60.4%.
That matters for silver because higher U.S. rates can increase the opportunity cost of holding a non-yielding asset. The $69-$71 area therefore becomes the first major test for the silver price.
The Key Silver Price Levels to Watch in September
The weekly chart gives us a fairly clean map. Silver’s August recovery came from the three-month price delivery area around $60.80. From there, price climbed into the monthly imbalance obstruction between approximately $69 and $71.
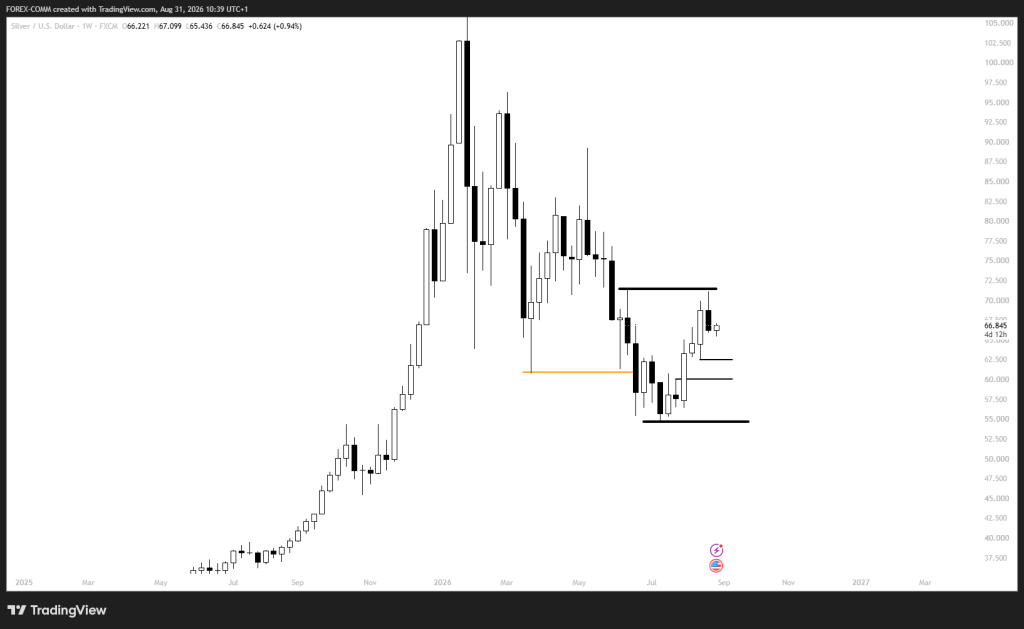
The first level to watch is $71. A weekly close above this zone would weaken the bearish case and open the door toward higher prices. If $71 continues to reject price, the chart points toward $62.50, followed by the $60 area.
The $60.80 level is particularly important because it is the three-month PD array from which the current recovery originated. Losing that area would expose the $54-$55 zone, marked by the lower weekly structure on the chart.
So the September battle is essentially between $71 on the upside and $60.80 on the downside.
Related Silver News: Here’s Why Gold and Silver Prices Are Getting Hammered Right Now
Bullish Scenario: Can Silver Break $72 and Target $80?
Yes. A clean break above $71-$72 would remove the main resistance standing between silver and the next higher price area.
The next major monthly PD array on the chart is around $89. That gives the bullish scenario room for silver to first target $80, followed by $89 if buying pressure remains strong.
For this setup to remain valid, the silver price needs to reclaim $71-$72 and avoid falling straight back below that zone. A weekly close above $72 would give buyers a stronger technical case for the $80 price, with $89 becoming the extended objective.
Bearish Scenario: Could Silver Fall Back Toward $60?
Yes. If the $71 resistance continues to hold, silver can retrace toward the weekly levels at $62.50 and $60.
The silver chart already shows these areas as internal support after the June-July decline. A break below $60.80 would weaken the recovery structure further and expose the $54-$55 monthly area.
That would mean the August rally was followed by a deeper September retracement rather than an immediate continuation toward $80.
Our Silver Price Prediction for September
Our three potential paths for the silver price are straightforward.
The bullish path is a break above $71-$72, followed by a move toward $80, with $89 as the next major objective.
The base path is rejection below $71 and a retracement toward $62.50-$60.80, where buyers could attempt to defend the August recovery.
The bearish path comes if $60.80 fails. In that case, silver could fall toward $54-$55, the lower monthly area marked on the chart.
For September, $71 is the key level separating the upside and downside scenarios.
Frequently Asked Questions
Subscribe to our YouTube channel for daily crypto updates, market insights, and expert analysis.