
Memecoins made most of the noise in the first half of 2026 and accounted for 1.1% of the volume on one major aggregator. New data shows how unevenly attention actually lands on new tokens.
The market’s appetite for new assets looked insatiable this half. Launchpad activity hit record daily volumes in early January. At the February peak, a single launchpad accounted for roughly half of Solana’s weekly decentralized turnover. If you spent half on crypto social media, you would reasonably conclude that new tokens were where all the action was.
The H1 2026 Swap Report from SimpleSwap, covering 26 weeks of swap activity from 1 January to 30 June, shows how much of that noise actually translated into use. Like every section of the report, the listings chapter opens with a public market benchmark before any platform figure appears. The result is uncomfortable for anyone who assumes that listing and demand are the same thing.
What you'll learn 👉
Ten a week in, 48 days to wait
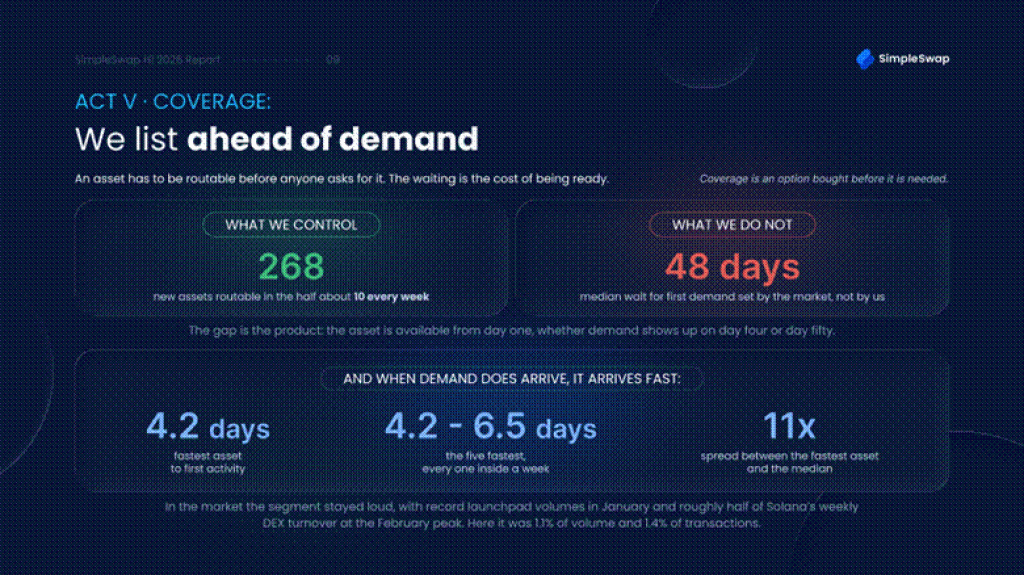
The platform made 268 assets routable over the half, averaging about ten a week. The median one then waited 48 days for its first meaningful activity, measured against a fixed threshold applied identically to every asset, which is what makes them comparable.
Seven weeks is a long time in a market that measures attention in hours.
The distribution around that median is what makes the finding useful. The fastest asset of the half reached its first activity at 101 hours (4.2 days). The five quickest launches all landed between 4.2 and 6.5 days, so each one cleared within a week. Between the fastest asset and the median, there is a spread of roughly eleven times.
That spread is not a measure of how quickly a venue can move. It measures how unevenly attention is distributed across new tokens. Once demand arrives, the infrastructure picks it up immediately. The problem is that demand arrives for very few of them, and nobody can tell in advance which ones.
Memecoins: 1.1% of volume, most of the conversation
The gap between noise and use gets starker in the loudest segment. Across the whole half, memecoins accounted for 1.1% of volume and 1.4% of transactions on the platform. The ratio between those two shares puts the average memecoin swap at roughly 79% of the platform average, so they were smaller and rarer trades as well.
The report is careful about what that does and does not prove. It is not evidence that memecoins faded, because the market data says the opposite. It is evidence of who swaps at this particular venue. For a business that runs substantially through wallets and other integrations, an audience weighted toward majors and long-tail routes rather than the most speculative corner of the market is a description of the customer base rather than a hole in the product.
Why keep listing at all
The obvious question is why a venue would add ten assets a week when the median one sits unused for seven. The report answers it with an asymmetry rather than an optimism.
Carrying a route that nobody uses costs almost nothing, because a route is a path rather than an inventory position. Nobody has to hold the asset for the pair to exist. Not carrying a route when someone wants it costs a user immediately, and in a business integration it can cost a partner, since the partner’s own customer hits the wall rather than the aggregator’s. Forty-eight days of waiting is a small premium against that.
The framing the report lands on is that catalogue length is not a shop window. It is an option bought before anyone needs it.
There is a second reason the maths works, which is that the platform cannot pick winners in advance. If a venue could reliably identify which of ten weekly launches would find an audience, listing selectively would be strictly cheaper. The eleven-fold spread between the fastest asset and the median is direct evidence that no such ability exists, since the winners are not merely rare but unpredictable in advance.
A partner sees the same gap
Kuvi.AI, currently in private beta, offered a qualitative read on the same pattern rather than a hard number. Their observation is that new listings do generate curiosity on arrival, but the team is deliberately careful not to claim that users consistently chase a newly listed asset once live activity gets measured. That is precisely the gap between attention and follow-through the report documents on its own platform.
Kuvi.AI also flagged a separate shift worth watching, namely growing use of automated strategies built by users themselves, which they describe as a step toward putting tools once reserved for professional desks into individual hands.
The number to remember
If you are building a listings strategy, the useful takeaway is not 268 and not 48. It is the eleven-fold spread between them. A small number of new assets find an audience within days. Most find one much later or never, and no amount of listing speed changes which group a token lands in.
Listings occupy the fifth of six sections. The rest of the report covers the contraction in swap volume against a spot market that roughly halved, rotation out of bitcoin at the swap layer while dominance climbed above 60%, stablecoin flows that stopped responding to Bitcoin drawdowns partway through the half, and network reach where 71.4% of transactions touched a chain outside the four largest.
About the report
The SimpleSwap H1 2026 Swap Report covers 1 January to 30 June 2026, benchmarked against the second half of 2025. Each section opens with a public market benchmark before any internal figure appears, drawing on CoinGecko for exchange volumes and capitalization, DeFiLlama together with Visa’s Allium-powered dashboard for stablecoin supply and settlement, Alternative.me for sentiment, and LI.FI plus Circle disclosures for cross-chain context. All figures are aggregated across swaps routed through the platform, and nothing in the report identifies a user, an address or the timing of an individual transaction. Exactly one dollar figure appears in the text, and it is a measurement threshold rather than a platform total. The report describes past market behavior and contains no price forecasts.
Full report and methodology at SimpleSwap blog. Media and analysts can request additional data cuts at marketing@simpleswap.io.
About SimpleSwap
SimpleSwap is a self-custodial multi-source swap aggregator. It draws liquidity from more than 20 CEX and DEX sources, covers 2,800+ assets, and handles provider and route selection under the hood. Over 8 years, 10M+ users have swapped through SimpleSwap, and 6,000+ projects use it as a business solution, including Exodus and Tangem. The only official SimpleSwap website is simpleswap.io.