The Chainlink price rose 1.65% to $8.81, holding up fine while Bitcoin dipped. Standard Chartered tossed out a $200 target for 2030, over 22 times higher. That kind of number makes people pay attention.
But let’s pump the brakes. Since 2021, the LINK price has been trapped in a tightening triangle on the chart. Lower highs keep pushing down. That top trendline is the real wall. Until the price breaks above it, the $200 talk is just talk.
The bank’s forecast gives believers a reason to hope. That’s fine. But the chart has to prove it first. And between here and there, LINK has plenty of smaller walls to knock down. One step at a time.
What you'll learn 👉
Standard Chartered Sets a $200 LINK Target
Standard Chartered Bank says Chainlink will hit $13 by the end of 2026. After that, they see it climbing higher, all the way to $200 by 2030.
Right now, the LINK price is at $8.81. To get to $13, it needs to go up about 47%. That’s a big jump, but it’s doable. And here’s the thing, 2026 is almost over. We’ve got less than five months left. So that $13 number? That’s the real test. If LINK can’t even get there, then forget about the rest.
Standard Chartered says $200 for $LINK by 2030
— Our Crypto Talk (@ourcryptotalk) August 12, 2026
The fundamentals support the thesis.
The chart hasn't confirmed it.
Here are some facts :
> A 25x target by 2030.
> @chainlink is still trading inside the same triangle it's been stuck in since 2021.
Those two things need to be… pic.twitter.com/scBUCYFu0H
But $200 is a whole different animal. From $8.81, that’s a 2,170% increase. You’d have to multiply your money by almost 23 times. Some people online are calling it a 25x play, but honestly, that depends on what price you bought at. Either way, we’re talking about a large gap between where it is now and where they say it’s going.
So forget the big dream for a minute. The only thing that matters right now is $13. That’s the first hurdle. That’s what tells us if this whole prediction has any legs at all.
Read Also: XRP Price Warning: Here’s Exactly When You Should Start Worrying
Chainlink Fundamentals Support the Forecast
Look at what’s happening underneath the price. The network is holding up over $110 billion worth of assets, that’s money, contracts, all kinds of value. So when people use DeFi, they’re depending on Chainlink’s data feeds to make it work. That’s a big deal.
Then there’s their cross-chain system, CCIP. The amount of activity going through that upgrade went up more than 350% over the last year. Not a little bump, that’s a big jump.
Now, the token itself. There will only ever be 1 billion LINK. Period. Right now, about 748 million of those are out there floating around. The rest are locked up.
The key question is whether that network activity produces enough direct token demand to support the price targets being projected for the coming years.
What LINK Needs to Break Before $200
We had a look at the attached LINK chart, and the structure is clear. The upper trendline begins near the $52.80 peak from May 2021 and connects a series of lower highs. At the same time, the lower boundary has moved upward from the 2022 lows, creating a contracting triangle.
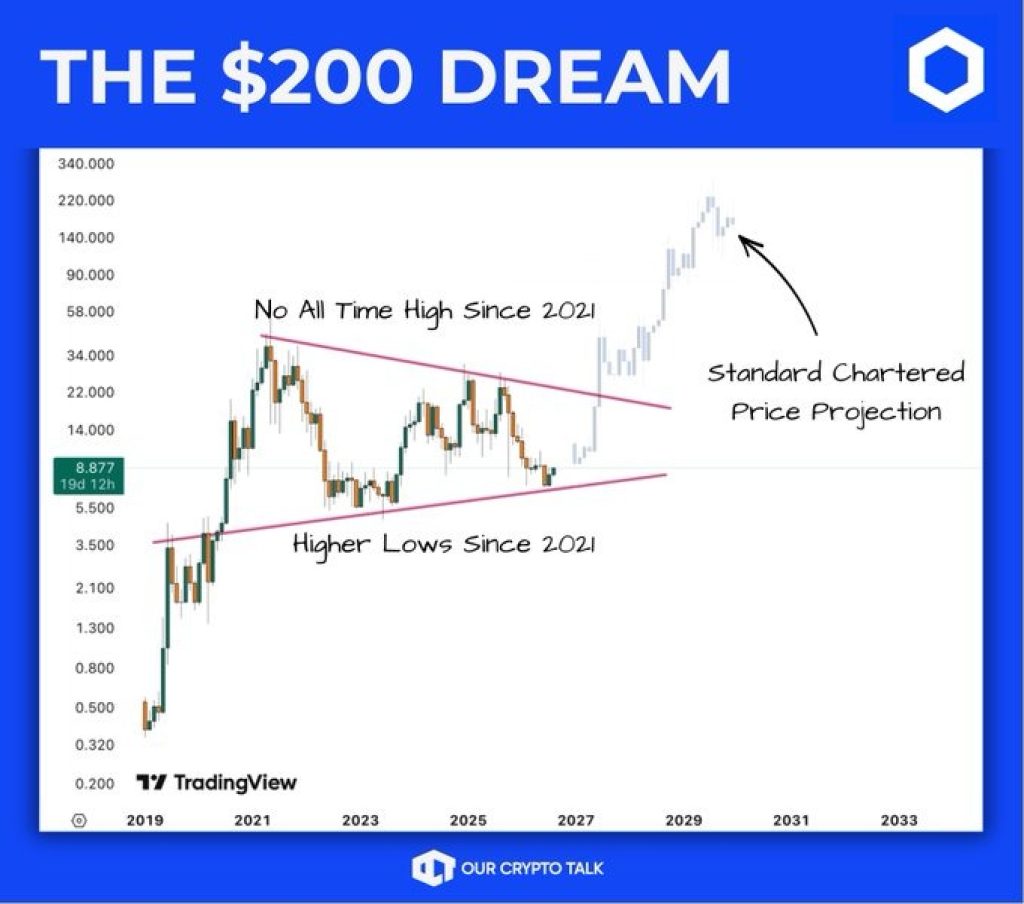
The LINK price is now around $8.81, close to the triangle’s apex. The chart shows that price has failed to establish a new all-time high since 2021, even as the lows have moved higher.
That means the first technical requirement is a break above the descending resistance line with strong volume.
A move through $13 would then provide another confirmation point. From there $20 and $30 become more realistic intermediate targets before the market can even consider the $200 projection.
Read Also: Crypto Price Prediction for Today, August 12: Solana (SOL), XRP, and Dogecoin (DOGE)
Does the Chainlink Reserve Change the Equation?
The Chainlink Reserve converts protocol fees into LINK purchases, creating recurring demand for the token. The Crypto Talk data estimates those purchases at roughly 1.2% of LINK’s market capitalization per year.
That provides a source of structural demand, but the number also puts the effect into perspective. A 1.2% annual market-cap purchase rate alone is unlikely to push LINK from $8.81 to $200. The bigger driver would need to be continued growth in Chainlink usage, fees and demand for LINK.
Chainlink Price Prediction: Where LINK Could Go
The bullish LINK price path begins with a break above the descending triangle, followed by a move through $13. If that level holds, $20 and $30 become the next areas to watch.
The base-case LINK price path keeps the token inside the triangle, with $8.70–$13 acting as the main range until stronger volume confirms a breakout.
The bearish path emerges if the Chainlink price fails around $9–$13 and loses the rising lower boundary. That would delay the $13 target and make the $200 forecast harder to validate.
However, Standard Chartered’s $200 LINK target is a fundamental forecast, not technical confirmation. Chainlink has $110 billion-plus in secured value and CCIP volume growth above 350%, but the chart still needs to clear a resistance structure that has existed since 2021.
For now, $13 is the number that matters most. If LINK breaks that level and clears its five-year descending trendline, the path toward $20, $30 and eventually much higher prices becomes far more credible.
Frequently Asked Questions
Subscribe to our YouTube channel for daily crypto updates, market insights, and expert analysis.