
Gold price has returned to a familiar decision zone after spending several weeks inside a narrowing technical pattern. One trader who reportedly profited from the previous decline now expects gold to revisit $4,500, although the chart shows several barriers standing between the current price and that target.
Hamza, who posts through the ElliottWavesHub account, shared the forecast and identified Ryker Crypto as the trader behind it. His previous gold call makes the latest prediction especially interesting, but gold must first escape its current triangle before the larger target becomes realistic.
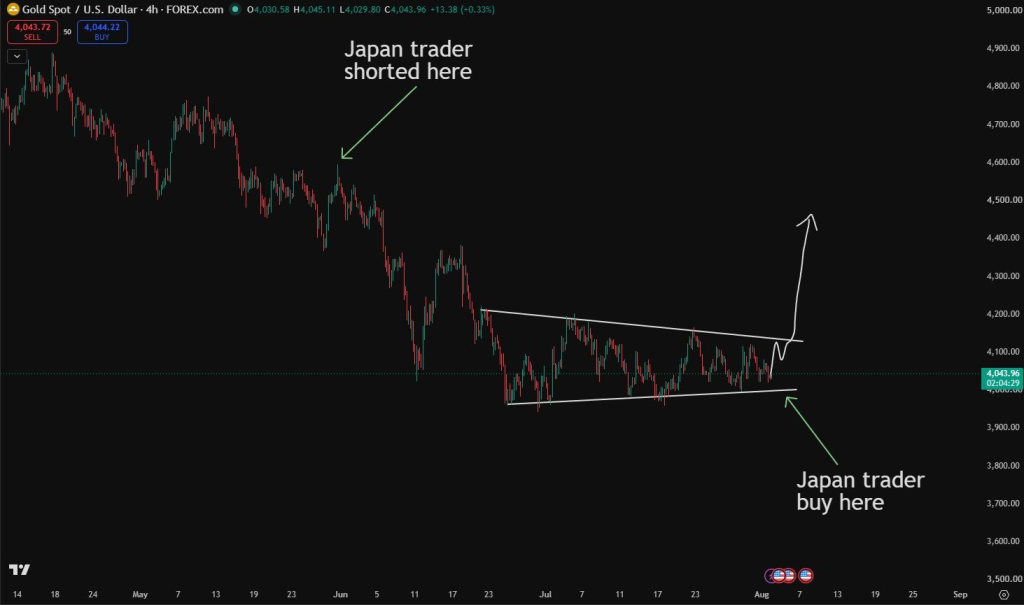
Hamza described Ryker Crypto as a Japanese trader who opened a short position when gold traded near $4,500. The trader reportedly closed that position around $4,000 and made millions from the decline.
That trade proved well timed because gold price continued falling after losing the $4,500 region. The chart attached to Hamza’s post marks the earlier short entry above $4,500 and shows the decline that followed.
Hamza also connected the gold prediction to another successful market call. Ryker Crypto reportedly bought Bitcoin near $4,000 during an earlier cycle and later sold his entire position at $96,000.
Those previous calls do not guarantee that the latest gold price prediction will succeed. Still, they provide useful context for why Hamza believes the new $4,500 target deserves attention.
Ryker Crypto now expects gold price to recover toward the same area where the earlier short trade began. The chart presents a possible purchase zone near the lower boundary of the current triangle, followed by a projected move toward $4,500.
What you'll learn 👉
Gold Price Is Testing Support Near $4,049
A look at the gold chart shows price near $4,044 after testing an important support region around $4,049. Buyers have defended this general area several times, which keeps the possibility of another upward attempt alive.
A rebound from this zone could return gold price toward the upper boundary of the triangle. Immediate price action remains compressed, so neither buyers nor sellers currently control the wider direction.
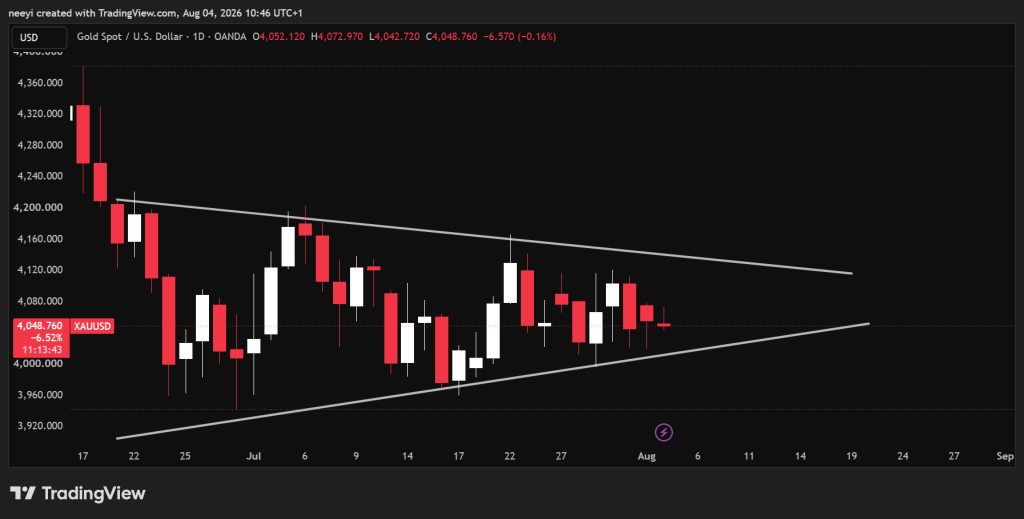
Gold has traded inside this triangle since late June. The upper boundary continues to move lower, and the lower boundary has gradually moved higher. Both lines are now close together, which means price has less room to remain inside the formation.
The following levels could determine the next major gold price move:
- Support remains close to $4,049, followed by the triangle base near $3,990.
- Initial resistance stands around $4,120 near the triangle’s upper boundary.
- Higher resistance levels appear near $4,200 and $4,380.
- Ryker Crypto’s main upside target remains close to $4,500.
A Break Above $4,120 Could Open the Route Toward $4,500
The first major test for this bullish gold price prediction stands near $4,120. That level matches the descending upper boundary of the triangle and has restricted several previous recovery attempts.
A confirmed break above $4,120 could give buyers room to challenge $4,200. Gold would then need to clear $4,380 before the $4,500 target becomes the main focus.
This route would likely develop through several stages instead of one uninterrupted move. Gold price could retest broken resistance levels before continuing upward, especially because the market has remained inside the triangle since June.
The $4,500 region also carries historical importance within Hamza’s analysis. Ryker Crypto reportedly opened the previous short position around that area, and the latest forecast expects price to return there.
A Drop Below $3,990 Would Weaken the Bullish Gold Price Prediction
The triangle can still break in either direction. Gold price may return to its lower boundary near $3,990 if support around $4,049 fails.
A decisive break below $3,990 would weaken the expected rebound and expose lower price levels. Sellers could then push gold toward $3,900, which represents the next major area identified through the chart.
Continued weakness below $3,900 could eventually place $3,720 within reach during the days that follow. Such a move would invalidate the immediate recovery setup and delay any return toward $4,500.
Gold price now faces a clear technical test. A move above $4,120 could open the route toward $4,200, $4,380, and eventually $4,500. A fall below $3,990 could instead expose $3,900 and $3,720. The narrowing triangle means gold may not remain undecided much longer, and its eventual breakout could determine whether Ryker Crypto adds another successful call to his record.
FAQs
Subscribe to our YouTube channel for daily crypto updates, market insights, and expert analysis.