
Chainlink traders got a clear signal this week, and it was not the kind bulls wanted to see. LINK slipped below a support level that had held for weeks, and the break came with enough force to change how several analysts view the chart. Crypto Patel was among the first to flag the move, and his read on the situation points toward a market that has quietly tilted in favor of sellers.
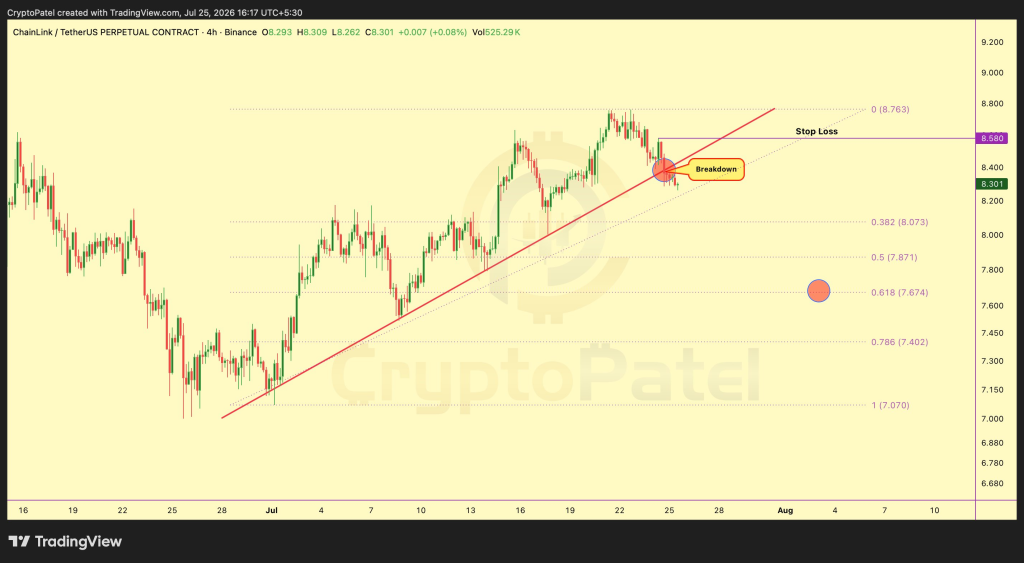
Analyst Crypto Patel posted a detailed breakdown of the LINK chart, and the message was direct. LINK lost the $8.38 support level, and that loss confirmed a break below the rising trendline that had been guiding price for some time.
According to Patel, this breakdown weakens the broader bullish structure that LINK had built over recent weeks. He framed it as a shift in favor of sellers, with price now expected to stay pressured as long as it remains below the level it just gave up.
Patel laid out a short setup for traders following the LINK price closely. He listed an entry zone between $8.38 and $8.48, with three separate downside targets.
- Entry range: $8.38 to $8.48
- Targets: $7.87, then $7.67, then $7.40
- Stop loss: $8.58
Patel closed his post with a simple line that summed up his view well. The trend has changed, he wrote, and traders should now watch for confirmation rather than hope for a reversal. He also included the standard disclaimer that his post is not financial advice and encouraged followers to do their own research.
A look at the LINK daily chart shows a market that has not fully picked a side yet. Several indicators point toward weakness, while a few others still leave room for buyers to argue their case. This split matters a great deal for anyone watching the Chainlink price right now, because the next confirmed direction could carry real weight either way.
A bearish resolution from here could open the door to a fast and painful move lower. A bullish reversal, on the other hand, would hand buyers a chance to reclaim the narrative and put the recent breakdown behind them.
Breaking Down Each LINK Technical Indicator One By One
The relative strength index on the daily chart currently sits near 44, and that reading places LINK in neutral territory with a slight lean toward weakness. It has not reached oversold levels yet, so there is still room for the number to fall further before any bounce becomes likely.
The moving average convergence divergence line is trading just below its signal line, with the histogram printing a small negative value close to the zero line. This kind of setup usually points to mild selling pressure beneath the surface, even when price has not yet moved dramatically.
Read Also: Where Is Chainlink Price Headed as $9 Million in LINK Exit Exchanges Within Hours
LINK is currently trading around $8.31, and that price sits below both the 50-day moving average near $8.75 and the 200-day moving average near $9.30. That alignment confirms a shorter-term downtrend, and it keeps both medium and longer-term trend readings pointed in the same bearish direction for now.
Daily trading volume has landed close to $150,000,000, and that figure came in above the recent average during the session when the $8.38 support gave way. A breakdown on light volume can often fail quickly, but heavier volume behind a drop like this one tends to draw more conviction from sellers.
Fibonacci retracement levels drawn from the last major swing put the $7.67 zone close to a key retracement point, and that number lines up almost exactly with one of the targets Crypto Patel mentioned in his post. That kind of overlap between separate technical tools can make a level more meaningful to traders watching for confirmation.
| Indicator | Current Value | Action |
|---|---|---|
| RSI (Daily) | Near 44, neutral leaning weak | Watch for further decline before expecting any bounce |
| MACD | Below signal line, histogram slightly negative | Leans bearish, adds weight to the breakdown |
| 50 Day Moving Average | Around $8.75, price trading below it | Confirms medium term downtrend is active |
| 200 Day Moving Average | Around $9.30, price trading below it | Keeps the longer term trend pointed lower for now |
| Volume | Near $150,000,000, above the recent average | Adds conviction to the current move lower |
| Fibonacci Levels | $7.67 aligns with a key retracement zone | Level worth watching if price continues down |
Chainlink has broken through support levels before, only to recover once buyers stepped back in with fresh conviction. The next few sessions should show whether this breakdown follows that familiar pattern or turns into something longer lasting for the LINK price.
FAQs
Subscribe to our YouTube channel for daily crypto updates, market insights, and expert analysis.