
Ethereum price has spent months under pressure, and every recovery attempt has struggled to gain enough strength to change the broader trend. That is why a chart pattern that appeared before Ethereum’s last 2 major rallies is getting fresh attention. This latest setup has emerged after another prolonged decline, raising an important question about whether ETH could finally be preparing for a stronger recovery.
Crypto analyst Crypto Patel believes the latest weekly chart has printed the third bullish engulfing pattern of this market cycle. Previous appearances of the same formation came before rallies of 169% and 253%, making this one worth watching even as Ethereum continues to trade well below its cycle highs.
What you'll learn 👉
Ethereum Price Chart Shows The Same Bullish Pattern That Led To Two Major Rallies
A bullish engulfing candle forms when a large bullish weekly candle completely covers the previous bearish candle. Technical analysts often view this as evidence that buyers have absorbed selling pressure and regained control after a prolonged decline.
Crypto Patel noted that Ethereum has now produced this pattern for the third time in the current cycle. The previous 2 appearances came before rallies of 169% and 253%, making the latest setup one of the more interesting technical developments on the Ethereum price chart.
The chart also points to several encouraging technical signals:
- This is the third bullish engulfing pattern in the current market cycle.
- The previous 2 identical setups preceded rallies of 169% and 253%.
- Higher time frame price action points to a possible bullish reversal.
- Selling pressure appears to be getting absorbed near key demand zones.
- Trend structure has started improving after months of lower highs and lower lows.
- Crypto Patel believes ETH could move toward $3,400, which represents roughly 125% upside from the level shown on the chart.
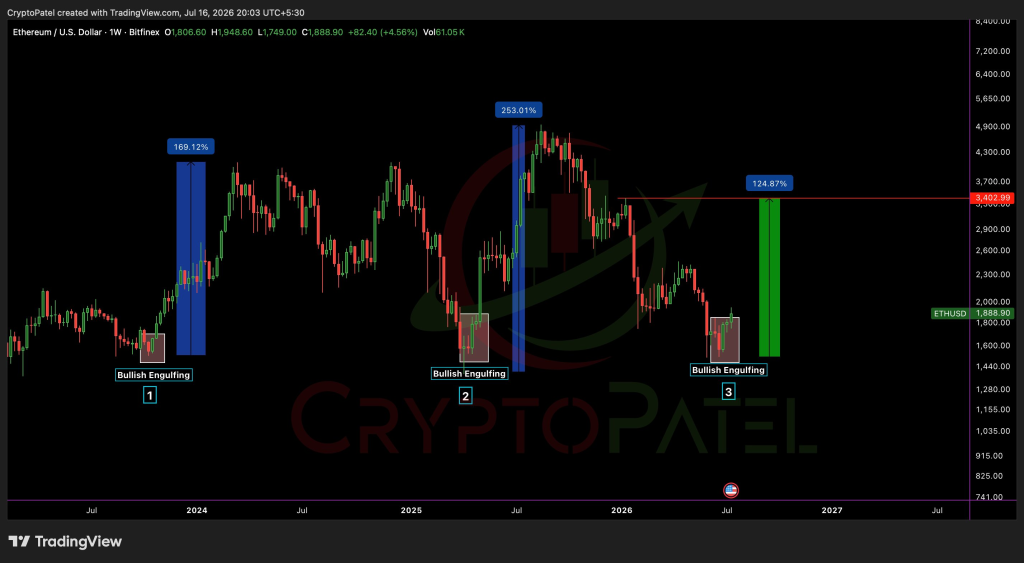
Crypto Patel also stressed one important condition. The weekly low created by the bullish engulfing candle needs to remain intact. A break below that level would weaken the current bullish setup and reduce the probability of another strong advance.
Ethereum Price Remains Well Below Its Previous Cycle High
The technical pattern arrives after a difficult period for Ethereum price.
ETH climbed into the mid $4,000s during late 2025 before the rally lost strength. Selling pressure quickly returned. Ethereum dropped to about $3,022 by November 2025 and stayed close to $3,000 through the end of that year.
Pressure continued throughout 2026. ETH traded near $2,144 in February before slipping to about $2,052 in March. A recovery toward roughly $2,376 in April failed to establish a lasting trend. Selling returned once again. Ethereum later traded close to $2,022 in May before falling to roughly $1,917 in July.
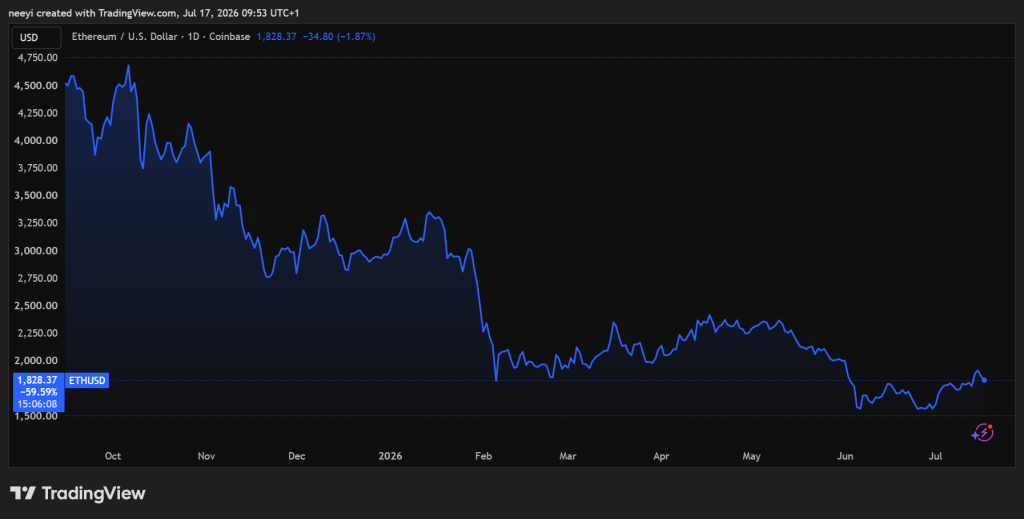
This steady decline differs from a panic-driven crash. Ethereum price has moved lower through a series of lower highs and lower lows. Every recovery attempt has struggled to stay above the low $2,000 region, which shows buyers have not fully regained control despite several rebounds.
Another factor deserves attention. Ethereum remains roughly half below its late 2025 peak, and the broader drawdown from its all time high is even deeper. That means any future rally toward the mid $4,000 region could face heavy selling pressure from investors who bought near those previous highs.
Ethereum Price Outlook Depends On Whether Buyers Can Build On This Signal
The return of this bullish engulfing pattern does not guarantee another rally. Market conditions remain very different from earlier stages of the cycle, and Ethereum still faces several important resistance levels.
Several paths could develop over the coming weeks:
- Recovery scenario: A move above recent bounce highs with strong trading volume could open room toward the upper $2,000 region. A successful breakout could later bring $3,000 into focus before attention turns to Crypto Patel’s $3,400 target.
- Range bound scenario: Ethereum price could continue trading between recent lows and the low $2,000 region as buyers and sellers battle for control.
- Bearish scenario: A break below recent support in the high $1,000 region could expose lower support zones that developed inprevious stages of the cycle.
The next 3 to 6 months will likely depend on more than chart patterns alone. Broader market conditions, investor appetite for risk, Ethereum network activity, staking demand, Layer 2 adoption, and major protocol developments could all influence the next major move.
FAQs
Subscribe to our YouTube channel for daily crypto updates, market insights, and expert analysis.