
Bitcoin price has entered another critical session after a steady wave of selling pressure pushed the market lower across multiple trading periods. XRP price has also slipped beneath an important support level, and Arbitrum price now sits close to a level that could decide its next move. Those developments make today an important session for traders watching whether buyers can regain control or whether sellers extend the latest decline.
A closer look at the charts reveals several key support and resistance levels that could shape price action over the next several hours. Technical indicators from Investing.com also offer clues about current market strength across Bitcoin, XRP, and Arbitrum.
What you'll learn 👉
Bitcoin Price Holds Above Critical Support After Consecutive Bearish Sessions
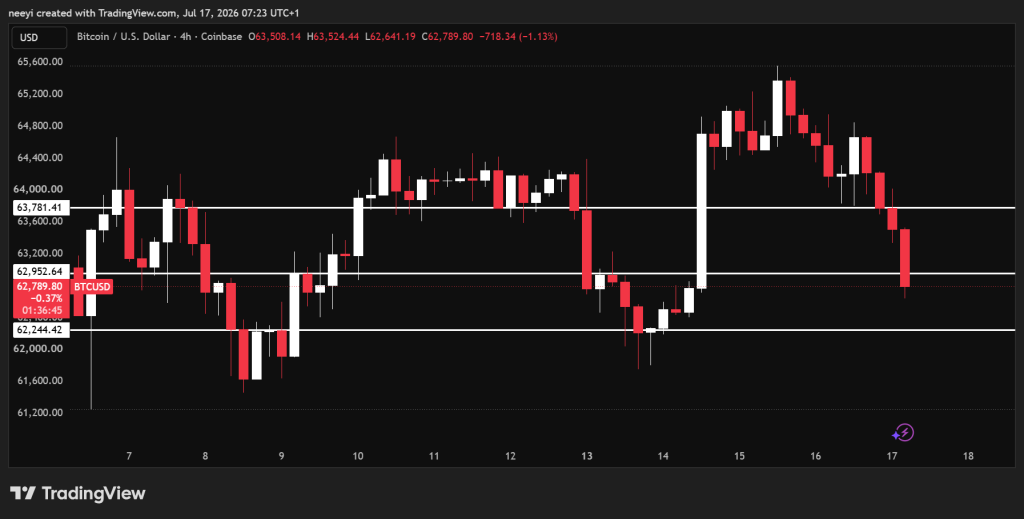
Bitcoin price trades around $63,000 after completing 4 consecutive bearish 4 hour candles. BTC has also recorded 2 consecutive bearish daily sessions, and today’s price action already points toward another weak performance.
Buyers now have an important level to defend around $62,950. A move below that support would strengthen the bearish case and could send Bitcoin price toward $62,200 before today’s session ends.
Recovery remains possible if buyers successfully defend that support. That outcome could keep BTC trading between $62,950 and $63,781 during most of the day. A decisive move above $63,781 would improve short-term sentiment and could allow Bitcoin price to climb toward $64,900.
The Relative Strength Index sits at 39.603 with a Sell signal. That reading shows buying strength has weakened, although BTC has not reached deeply oversold conditions.
MACD stands at negative 40.7 with another Sell signal. Momentum continues to favor sellers, and buyers have not produced enough strength to reverse the recent decline.
The Ultimate Oscillator records 34.882 and also points to Sell. Multiple timeframes continue to lean toward bearish momentum.
Bull Bear Power comes in at negative 2012.51 with a Sell signal. Sellers still control the short-term trend, although strong support could slow additional downside.
| Name | Value | Action |
|---|---|---|
| RSI (14) | 39.603 | Sell |
| MACD (12,26) | -40.7 | Sell |
| Ultimate Oscillator | 34.882 | Sell |
| Bull/Bear Power (13) | -2012.51 | Sell |
Bitcoin Price Prediction for Today
Bullish: A move above $63,781 could open the path toward $64,900.
Neutral: Bitcoin price may remain between $62,950 and $63,781 if buyers continue defending support.
Bearish: A break below $62,950 could send BTC down to around $62,200.
XRP Price Slips Below Key Support as Buyers Face Immediate Test
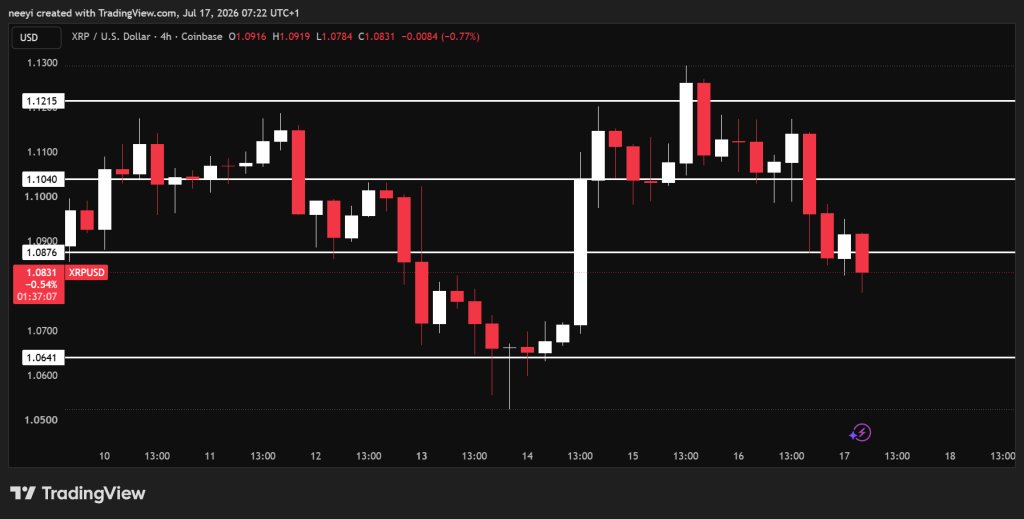
XRP price currently trades around $1.079 after closing below the important $1.087 support level. That breakdown has weakened the short term structure and leaves the next support near $1.064 as today’s primary downside target.
Buyers still have an opportunity to regain control. A recovery above $1.087 would improve the technical picture and could lift XRP price toward $1.10. Continued buying above that level may extend the move toward $1.12 before the session closes.
The Relative Strength Index stands at 42.974 with a Sell signal. Buying activity remains limited, although XRP has not entered oversold territory.
MACD currently reads 0 with a Sell signal. Momentum remains weak despite the absence of a large bearish reading.
The Ultimate Oscillator prints 45.612 and also favors Sell. Short term strength continues to lean toward sellers.
Bull Bear Power stands at negative 0.0168 with another Sell signal. Sellers still maintain a slight advantage.
| Name | Value | Action |
|---|---|---|
| RSI (14) | 42.974 | Sell |
| MACD (12,26) | 0 | Sell |
| Ultimate Oscillator | 45.612 | Sell |
| Bull/Bear Power (13) | -0.0168 | Sell |
XRP Price Prediction for Today
Bullish: A move above $1.087 could push XRP price toward $1.10. Strong follow through could extend the rally to around $1.12.
Neutral: XRP price could spend much of the day moving between $1.064 and $1.087 if neither buyers nor sellers gain clear control.
Bearish: A break below $1.064 could extend today’s weakness and increase downside pressure.
Arbitrum Price Continues Defending Key Support Zone
Arbitrum price trades around $0.089 and remains slightly above the important $0.087 support area. That level has become the key line to watch during today’s session.
Failure to hold above $0.087 would strengthen the bearish outlook and could drag ARB price toward $0.083.
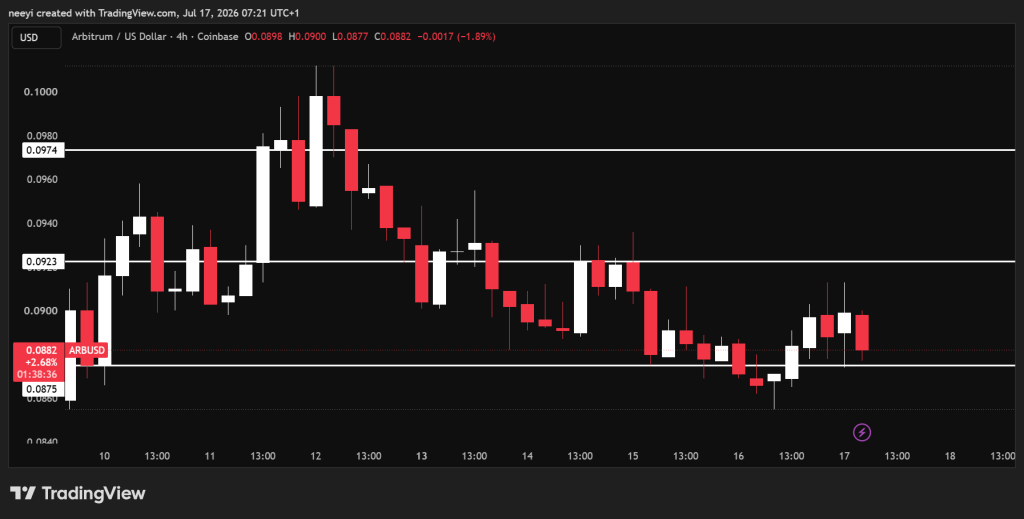
Support could still produce a recovery. Price may continue moving between $0.087 and $0.092 if buyers defend current levels. A move above $0.092 would strengthen the bullish case and could send Arbitrum price toward $0.097.
The Relative Strength Index stands at 48.923 with a Neutral reading. Momentum remains balanced and leaves room for either direction.
MACD currently gives a Buy signal despite recording a value of 0. Buyers have started showing early signs of improvement.
The Ultimate Oscillator reads 46.423 with a Sell signal. Broader momentum still leans slightly toward the downside.
Bull Bear Power prints 0.0009 and generates a Buy signal. Buyers have regained a small advantage near support.
| Name | Value | Action |
|---|---|---|
| RSI (14) | 48.923 | Neutral |
| MACD (12,26) | 0 | Buy |
| Ultimate Oscillator | 46.423 | Sell |
| Bull/Bear Power (13) | 0.0009 | Buy |
Arbitrum Price Prediction for Today
Bullish: A break above $0.092 could lift Arbitrum price toward $0.097.
Neutral: ARB price may continue trading between $0.087 and $0.092 if current support remains intact.
Bearish: A move below $0.087 could send Arbitrum price down to around $0.083.
FAQs
Subscribe to our YouTube channel for daily crypto updates, market insights, and expert analysis.